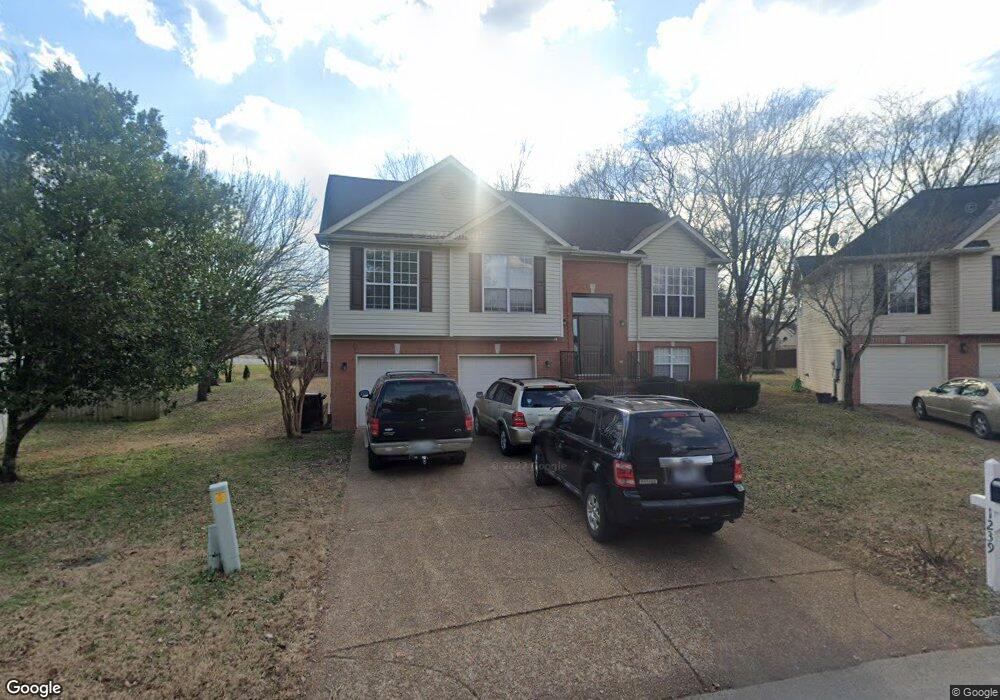
1239 Kelly Ct Franklin, TN 37064
West Franklin NeighborhoodEstimated Value: $532,657 - $661,000
--
Bed
4
Baths
1,453
Sq Ft
$419/Sq Ft
Est. Value
About This Home
This home is located at 1239 Kelly Ct, Franklin, TN 37064 and is currently estimated at $609,414, approximately $419 per square foot. 1239 Kelly Ct is a home located in Williamson County with nearby schools including Poplar Grove K-4, Johnson Elementary School, and Poplar Grove 5-8.
Ownership History
Date
Name
Owned For
Owner Type
Purchase Details
Closed on
Oct 17, 2008
Sold by
Pastin Dean C and Pastin Janna H
Bought by
Todd William E and Todd Jody L
Current Estimated Value
Home Financials for this Owner
Home Financials are based on the most recent Mortgage that was taken out on this home.
Original Mortgage
$234,000
Outstanding Balance
$154,931
Interest Rate
6.34%
Mortgage Type
Purchase Money Mortgage
Estimated Equity
$454,483
Purchase Details
Closed on
Aug 25, 1997
Sold by
Johns Larry T and Johns Cynthia A
Bought by
Bozeman James F and Bozeman Carolyn D
Home Financials for this Owner
Home Financials are based on the most recent Mortgage that was taken out on this home.
Original Mortgage
$138,400
Interest Rate
7.43%
Purchase Details
Closed on
Aug 21, 1997
Sold by
Radnor Homes Inc
Bought by
Pastin Dean C and Pastin Janna H
Home Financials for this Owner
Home Financials are based on the most recent Mortgage that was taken out on this home.
Original Mortgage
$138,400
Interest Rate
7.43%
Create a Home Valuation Report for This Property
The Home Valuation Report is an in-depth analysis detailing your home's value as well as a comparison with similar homes in the area
Home Values in the Area
Average Home Value in this Area
Purchase History
| Date | Buyer | Sale Price | Title Company |
|---|---|---|---|
| Todd William E | $260,000 | Homeland Title | |
| Bozeman James F | $130,090 | -- | |
| Pastin Dean C | $173,000 | -- |
Source: Public Records
Mortgage History
| Date | Status | Borrower | Loan Amount |
|---|---|---|---|
| Open | Todd William E | $234,000 | |
| Previous Owner | Pastin Dean C | $138,400 |
Source: Public Records
Tax History Compared to Growth
Tax History
| Year | Tax Paid | Tax Assessment Tax Assessment Total Assessment is a certain percentage of the fair market value that is determined by local assessors to be the total taxable value of land and additions on the property. | Land | Improvement |
|---|---|---|---|---|
| 2024 | $2,738 | $96,725 | $25,000 | $71,725 |
| 2023 | $2,632 | $96,725 | $25,000 | $71,725 |
| 2022 | $2,632 | $96,725 | $25,000 | $71,725 |
| 2021 | $2,632 | $96,725 | $25,000 | $71,725 |
| 2020 | $2,207 | $68,375 | $17,500 | $50,875 |
| 2019 | $2,207 | $68,375 | $17,500 | $50,875 |
| 2018 | $2,159 | $68,375 | $17,500 | $50,875 |
| 2017 | $2,125 | $68,375 | $17,500 | $50,875 |
| 2016 | $0 | $68,375 | $17,500 | $50,875 |
| 2015 | -- | $54,900 | $13,750 | $41,150 |
| 2014 | -- | $54,900 | $13,750 | $41,150 |
Source: Public Records
Map
Nearby Homes
- 3126 Annfield Way
- 1407 Clairmonte Cir
- 3126 Bush Dr
- 1839 William Campbell Ct
- 310 Devonshire Dr
- 601 Boyd Mill Ave Unit J1
- 601 Boyd Mill Ave Unit Q5
- 216 Devrow Ct
- 215 Wrennewood Ln
- 5112 Terravista Ln
- 226 Wrennewood Ln
- 504 N Petway St
- 1016 Benelli Park Ct
- 503 N Petway St
- 301 Connelly Ct
- 100 Cottage Ln
- 305 Abram Ct
- 132 Alexander Dr
- 1204 Brookwood Ave
- 961 Glass St
- 1237 Kelly Ct
- 1241 Kelly Ct
- 1235 Kelly Ct
- 3135 Bruce Gardens Cir
- 1240 Kelly Ct
- 3136 Bruce Gardens Cir
- 3109 Harrowden Ln
- 1233 Kelly Ct
- 1238 Kelly Ct
- 1236 Kelly Ct
- 3131 Bruce Gardens Cir
- 1231 Kelly Ct
- 3122 Friars Bridge Pass
- 1234 Kelly Ct
- 3132 Bruce Gardens Cir
- 1230 Kelly Ct
- 3105 Harrowden Ln
- 3118 Friars Bridge Pass
- 3126 Friars Bridge Pass
- 1229 Kelly Ct