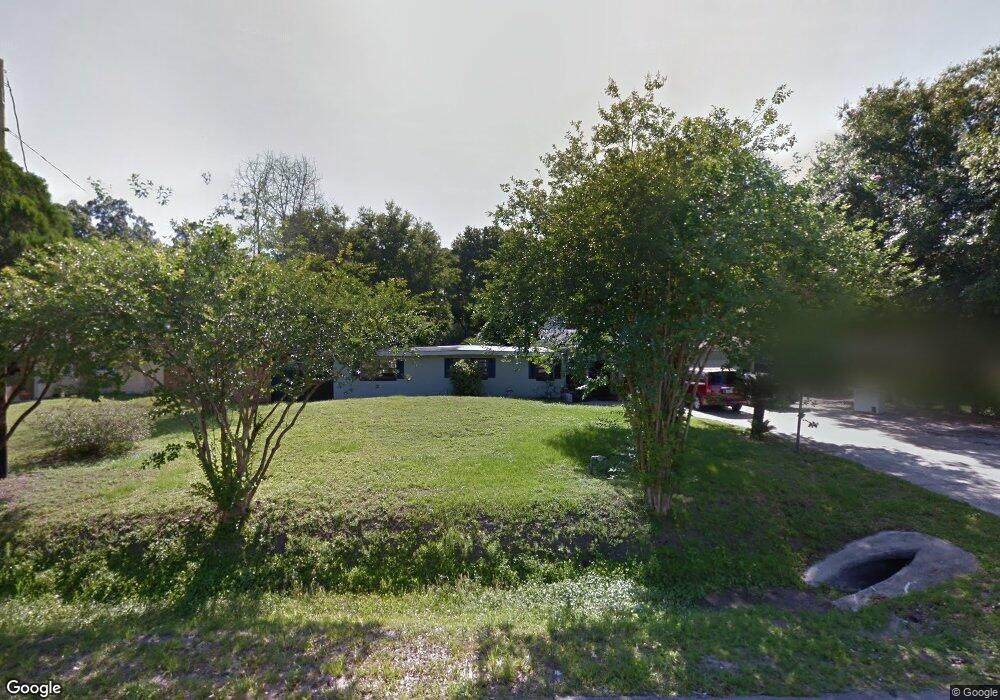
1239 Myrtle St Orlando, FL 32807
Estimated Value: $363,000 - $483,000
5
Beds
3
Baths
2,582
Sq Ft
$158/Sq Ft
Est. Value
About This Home
This home is located at 1239 Myrtle St, Orlando, FL 32807 and is currently estimated at $407,368, approximately $157 per square foot. 1239 Myrtle St is a home located in Orange County with nearby schools including Baldwin Park Elementary, Glenridge Middle, and Winter Park High.
Ownership History
Date
Name
Owned For
Owner Type
Purchase Details
Closed on
Sep 24, 2020
Sold by
Linares David and Morfa Daisy
Bought by
Librado Evert E and Librado Sugey G
Current Estimated Value
Home Financials for this Owner
Home Financials are based on the most recent Mortgage that was taken out on this home.
Original Mortgage
$200,000
Outstanding Balance
$171,202
Interest Rate
2.9%
Mortgage Type
New Conventional
Estimated Equity
$236,166
Purchase Details
Closed on
Jun 26, 2015
Sold by
Blue Label Holdings 1 Llc
Bought by
Linares David R and Morfa Daisy
Purchase Details
Closed on
May 9, 2007
Sold by
Shao Shiyuan and Duan Weili
Bought by
888 Llc
Purchase Details
Closed on
Aug 29, 2001
Sold by
Gregory A Theophilus M and Theophilus M Giuseppina G
Bought by
Shao Shiyuan and Shao Weili D
Home Financials for this Owner
Home Financials are based on the most recent Mortgage that was taken out on this home.
Original Mortgage
$94,400
Interest Rate
7.08%
Mortgage Type
New Conventional
Create a Home Valuation Report for This Property
The Home Valuation Report is an in-depth analysis detailing your home's value as well as a comparison with similar homes in the area
Home Values in the Area
Average Home Value in this Area
Purchase History
| Date | Buyer | Sale Price | Title Company |
|---|---|---|---|
| Librado Evert E | $250,000 | Attorney | |
| Linares David R | $100,000 | Stonebridge Title Group Llc | |
| Blue Label Holdings I Llc | $85,000 | Stonebridge Title Group Llc | |
| 888 Llc | -- | Attorney | |
| Shao Shiyuan | $118,000 | -- |
Source: Public Records
Mortgage History
| Date | Status | Borrower | Loan Amount |
|---|---|---|---|
| Open | Librado Evert E | $200,000 | |
| Previous Owner | Shao Shiyuan | $94,400 |
Source: Public Records
Tax History Compared to Growth
Tax History
| Year | Tax Paid | Tax Assessment Tax Assessment Total Assessment is a certain percentage of the fair market value that is determined by local assessors to be the total taxable value of land and additions on the property. | Land | Improvement |
|---|---|---|---|---|
| 2025 | $5,308 | $342,092 | -- | -- |
| 2024 | $4,735 | $310,993 | -- | -- |
| 2023 | $4,735 | $319,314 | $90,000 | $229,314 |
| 2022 | $4,127 | $259,795 | $65,000 | $194,795 |
| 2021 | $3,681 | $212,413 | $55,000 | $157,413 |
| 2020 | $2,467 | $155,067 | $55,000 | $100,067 |
| 2019 | $2,323 | $133,479 | $48,000 | $85,479 |
| 2018 | $2,212 | $129,377 | $45,000 | $84,377 |
| 2017 | $1,909 | $99,368 | $40,000 | $59,368 |
| 2016 | $2,303 | $121,778 | $40,000 | $81,778 |
| 2015 | $1,811 | $94,088 | $25,000 | $69,088 |
| 2014 | $1,722 | $85,286 | $25,000 | $60,286 |
Source: Public Records
Map
Nearby Homes
- 0 N SEMORAN BLVD N Semoran Blvd
- 1206 Coletta Dr
- 1310 Coletta Dr
- 1427 N Semoran Blvd
- 1433 Kingston Ave
- 5525 Barma St
- 5851 Cornelia Ave
- 0 N Semoran Blvd Unit MFRS5118983
- 6117 Cornelia Ave
- 5216 Sunrise Blvd
- 694 Golden Sunshine Cir
- 706 Golden Sunshine Cir
- 717 Golden Sunshine Cir
- 5416 Penway Dr
- 5356 Penway Dr
- 739 Golden Sunshine Cir
- 743 Golden Sunshine Cir
- 1225 Susannah Blvd
- 5476 Penway Dr
- 639 Golden Sunshine Cir
- 5717 Old Cheney Hwy
- 1214 Myrtle St
- 5801 Old Cheney Hwy
- 1222 Myrtle St
- 1217 Myrtle St
- 1223 Myrtle St
- 5807 Old Cheney Hwy
- 1231 Myrtle St
- 1212 Coletta Dr
- 1220 Coletta Dr
- 5722 Old Cheney Hwy
- 1277 N Semoran Blvd Unit 101
- 1277 N Semoran Blvd Unit 118
- 1277 N Semoran Blvd
- 1107 N Semoran Blvd
- 1120 Coletta Dr
- 1222 N Semoran Blvd
- 1234 Coletta Dr
- 1245 Myrtle St
- 5903 Old Cheney Hwy