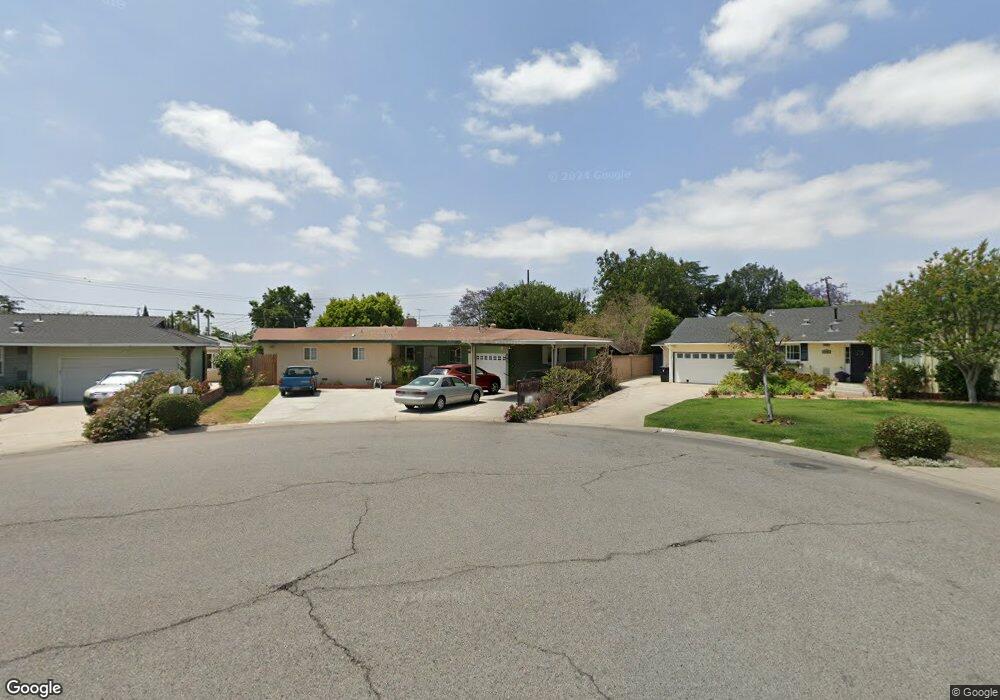
12391 Janet Cir Garden Grove, CA 92841
Estimated Value: $1,032,000 - $1,228,000
4
Beds
3
Baths
1,714
Sq Ft
$661/Sq Ft
Est. Value
About This Home
This home is located at 12391 Janet Cir, Garden Grove, CA 92841 and is currently estimated at $1,133,157, approximately $661 per square foot. 12391 Janet Cir is a home located in Orange County with nearby schools including Brookhurst Elementary School, Rancho Alamitos High School, and St. Columban School.
Ownership History
Date
Name
Owned For
Owner Type
Purchase Details
Closed on
Oct 20, 2016
Sold by
Alejandro Leilani
Bought by
Alejandro Leilani and Alejandro Nolan
Current Estimated Value
Purchase Details
Closed on
Feb 18, 2005
Sold by
Alejandro Nolan
Bought by
Alejandro Leilani
Purchase Details
Closed on
Apr 7, 1999
Sold by
Cain Emil R and Cain Claudia M
Bought by
Alejandro Leilani
Home Financials for this Owner
Home Financials are based on the most recent Mortgage that was taken out on this home.
Original Mortgage
$168,500
Interest Rate
9.25%
Purchase Details
Closed on
Nov 7, 1994
Sold by
Branchaud Linda L
Bought by
Cain Emil R and Cain Claudia M
Home Financials for this Owner
Home Financials are based on the most recent Mortgage that was taken out on this home.
Original Mortgage
$157,500
Interest Rate
9.5%
Create a Home Valuation Report for This Property
The Home Valuation Report is an in-depth analysis detailing your home's value as well as a comparison with similar homes in the area
Home Values in the Area
Average Home Value in this Area
Purchase History
| Date | Buyer | Sale Price | Title Company |
|---|---|---|---|
| Alejandro Leilani | -- | None Available | |
| Alejandro Leilani | -- | North American Title Co | |
| Alejandro Leilani | -- | North American Title Co | |
| Alejandro Leilani | $225,000 | Old Republic Title Company | |
| Cain Emil R | $175,000 | Old Republic Title Company |
Source: Public Records
Mortgage History
| Date | Status | Borrower | Loan Amount |
|---|---|---|---|
| Previous Owner | Alejandro Leilani | $168,500 | |
| Previous Owner | Cain Emil R | $157,500 |
Source: Public Records
Tax History Compared to Growth
Tax History
| Year | Tax Paid | Tax Assessment Tax Assessment Total Assessment is a certain percentage of the fair market value that is determined by local assessors to be the total taxable value of land and additions on the property. | Land | Improvement |
|---|---|---|---|---|
| 2025 | $4,979 | $402,686 | $250,338 | $152,348 |
| 2024 | $4,979 | $394,791 | $245,430 | $149,361 |
| 2023 | $4,885 | $387,050 | $240,617 | $146,433 |
| 2022 | $4,779 | $379,461 | $235,899 | $143,562 |
| 2021 | $4,727 | $372,021 | $231,273 | $140,748 |
| 2020 | $4,663 | $368,207 | $228,902 | $139,305 |
| 2019 | $4,574 | $360,988 | $224,414 | $136,574 |
| 2018 | $4,481 | $353,910 | $220,013 | $133,897 |
| 2017 | $4,418 | $346,971 | $215,699 | $131,272 |
| 2016 | $4,200 | $340,168 | $211,469 | $128,699 |
| 2015 | $4,141 | $335,059 | $208,293 | $126,766 |
| 2014 | $4,039 | $328,496 | $204,213 | $124,283 |
Source: Public Records
Map
Nearby Homes
- 12342 Rea Cir
- 12424 Lambert Cir
- 9731 Halekulani Dr
- 12071 Marlowe Dr
- 9052 Marie Ln
- 10181 Lampson Ave
- 9371 Cellini Ave
- 12266 Madras Place
- 9022 Marlene Ave
- 12861 Alamitos Way
- 8895 Sequoia Ct
- 9370 W Garden Grove Blvd
- 12262 Morrie Ln
- 13100 Gilbert St Unit 28
- 10072 Roselee Dr
- 10402 Law Dr
- 9651 Crosby Ave
- 9931 Swallow Ln
- 11841 Magnolia St
- 10442 Lampson Ave
- 12381 Janet Cir
- 12392 Marilyn Cir
- 12401 Janet Cir
- 12402 Marilyn Cir
- 12382 Marilyn Cir
- 12341 Rea Cir
- 12382 Janet Cir
- 12437 Lambert Cir
- 12342 Loretta Cir
- 12346 Rea Cir
- 12443 Lambert Cir
- 12392 Janet Cir
- 12346 Loretta Cir
- 12402 Janet Cir
- 12331 Rea Cir
- 12332 Loretta Cir
- 12381 Marilyn Cir
- 12433 Lambert Cir
- 12341 Loretta Cir
- 12391 Marilyn Cir