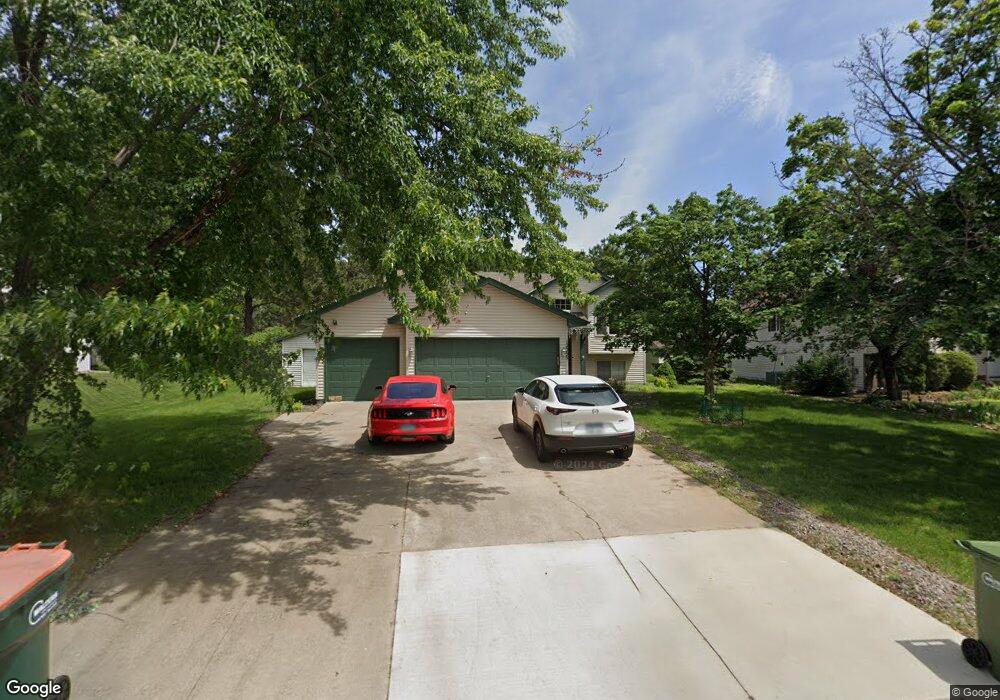
12399 Buchanan St NE Minneapolis, MN 55434
Estimated Value: $386,000 - $409,402
3
Beds
2
Baths
1,962
Sq Ft
$203/Sq Ft
Est. Value
About This Home
This home is located at 12399 Buchanan St NE, Minneapolis, MN 55434 and is currently estimated at $398,101, approximately $202 per square foot. 12399 Buchanan St NE is a home located in Anoka County with nearby schools including Jefferson Elementary School, Roosevelt Middle School, and Blaine Senior High School.
Ownership History
Date
Name
Owned For
Owner Type
Purchase Details
Closed on
Feb 11, 2020
Sold by
Smith Jason
Bought by
Shinde Devendra and Ahire Priyanka
Current Estimated Value
Purchase Details
Closed on
Aug 8, 2018
Sold by
Palmi Danny R and Palmi Diane J
Bought by
Smith Jason
Home Financials for this Owner
Home Financials are based on the most recent Mortgage that was taken out on this home.
Original Mortgage
$284,950
Interest Rate
4.5%
Mortgage Type
VA
Purchase Details
Closed on
Nov 30, 1998
Sold by
Olson Chad M and Olson Darra A
Bought by
Palmi Danny R and Palmi Diane J
Purchase Details
Closed on
Jan 12, 1996
Sold by
Tkaczik Richard
Bought by
Olson Chad M
Purchase Details
Closed on
Dec 1, 1995
Sold by
Scenic Enterpris
Bought by
Richard Tkaczik Construction Inc
Purchase Details
Closed on
Feb 2, 1992
Sold by
Hwy 65 Associate
Bought by
Scenic Enterprises Inc
Create a Home Valuation Report for This Property
The Home Valuation Report is an in-depth analysis detailing your home's value as well as a comparison with similar homes in the area
Home Values in the Area
Average Home Value in this Area
Purchase History
| Date | Buyer | Sale Price | Title Company |
|---|---|---|---|
| Shinde Devendra | $294,000 | First Fincl Ttl Agcy Of Mn I | |
| Smith Jason | $279,000 | Results Title | |
| Palmi Danny R | $128,900 | -- | |
| Olson Chad M | $105,050 | -- | |
| Richard Tkaczik Construction Inc | $26,900 | -- | |
| Scenic Enterprises Inc | $5,000 | -- |
Source: Public Records
Mortgage History
| Date | Status | Borrower | Loan Amount |
|---|---|---|---|
| Previous Owner | Smith Jason | $284,950 |
Source: Public Records
Tax History Compared to Growth
Tax History
| Year | Tax Paid | Tax Assessment Tax Assessment Total Assessment is a certain percentage of the fair market value that is determined by local assessors to be the total taxable value of land and additions on the property. | Land | Improvement |
|---|---|---|---|---|
| 2025 | $4,283 | $393,700 | $112,900 | $280,800 |
| 2024 | $4,283 | $372,800 | $111,100 | $261,700 |
| 2023 | $3,536 | $375,100 | $105,700 | $269,400 |
| 2022 | $3,260 | $371,100 | $92,400 | $278,700 |
| 2021 | $3,166 | $306,000 | $77,000 | $229,000 |
| 2020 | $3,136 | $291,300 | $77,000 | $214,300 |
| 2019 | $3,002 | $278,600 | $72,000 | $206,600 |
| 2018 | $2,700 | $262,000 | $0 | $0 |
| 2017 | $2,414 | $232,700 | $0 | $0 |
| 2016 | $2,483 | $210,400 | $0 | $0 |
| 2015 | -- | $210,400 | $64,700 | $145,700 |
| 2014 | -- | $180,300 | $52,000 | $128,300 |
Source: Public Records
Map
Nearby Homes
- 11670 Pierce Ct NE
- 1132 Buchanan Cir NE
- 12265 Fillmore St NE
- 12123 Oak Park Blvd NE
- 1156 128th Ave NE
- 12775 Ulysses Cir NE
- 12171 Duke Dr NE
- 12209 Davenport St NE
- 12630 Able Cir NE
- 1677 124th Ave NE
- 1653 123rd Ave NE
- 792 125th Ln NE
- 11995 Aberdeen St NE Unit 11995
- 12024 Oak Park Blvd NE
- 1000 Oak Ridge Point NE
- 12980 Ulysses St NE
- 13018 Ulysses St NE
- 12101 Hastings St NE
- 11741 Fillmore St NE
- 13084 Baltimore St NE
- 12415 Buchanan St NE
- 12387 Buchanan St NE
- 12429 Buchanan St NE
- 12398 Buchanan St NE
- 12371 Buchanan St NE
- 1209 124th Ct NE
- 12384 Buchanan St NE
- 12353 Buchanan St NE
- 12443 Buchanan St NE
- 12364 Buchanan St NE
- 1190 124th Ct NE
- 1191 124th Ct NE
- 12444 Johnson St NE
- 12438 Johnson St NE
- 12436 Johnson St NE
- 12350 Buchanan St NE
- 12347 Buchanan St NE
- 1206 124th Ln NE
- 12449 Buchanan St NE
- 1179 124th Ct NE