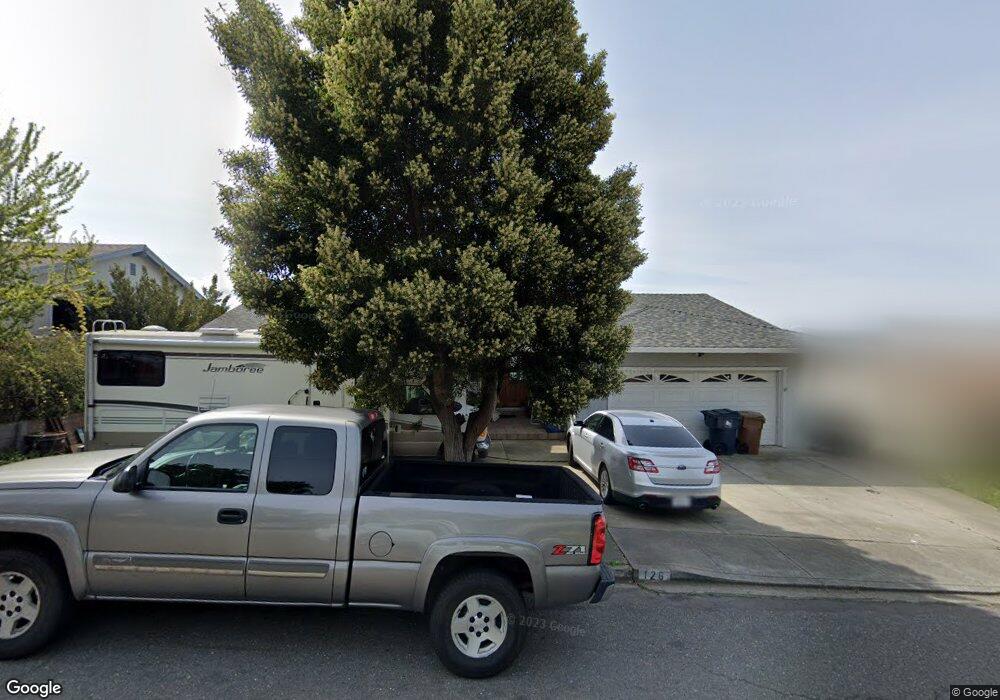
124 Ardmore Way Benicia, CA 94510
Estimated Value: $794,000 - $910,000
3
Beds
2
Baths
1,762
Sq Ft
$489/Sq Ft
Est. Value
About This Home
This home is located at 124 Ardmore Way, Benicia, CA 94510 and is currently estimated at $860,942, approximately $488 per square foot. 124 Ardmore Way is a home located in Solano County with nearby schools including Mary Farmar Elementary School, Benicia Middle School, and Benicia High School.
Ownership History
Date
Name
Owned For
Owner Type
Purchase Details
Closed on
Sep 21, 2022
Sold by
Barocio Yesenia
Bought by
Yesenia Barocio Trust
Current Estimated Value
Purchase Details
Closed on
Sep 4, 2013
Sold by
Gordon Lilias
Bought by
Barocio Yesenia
Home Financials for this Owner
Home Financials are based on the most recent Mortgage that was taken out on this home.
Original Mortgage
$405,000
Interest Rate
4.27%
Mortgage Type
New Conventional
Purchase Details
Closed on
Feb 7, 1996
Sold by
Atkins Lorraine
Bought by
Gordon Lilias
Purchase Details
Closed on
Aug 16, 1995
Sold by
Arneson Rosemary D
Bought by
Gordon Lilias
Create a Home Valuation Report for This Property
The Home Valuation Report is an in-depth analysis detailing your home's value as well as a comparison with similar homes in the area
Home Values in the Area
Average Home Value in this Area
Purchase History
| Date | Buyer | Sale Price | Title Company |
|---|---|---|---|
| Yesenia Barocio Trust | -- | -- | |
| Barocio Yesenia | $450,000 | Old Republic Title Company | |
| Gordon Lilias | $235,000 | Chicago Title Co | |
| Gordon Lilias | $188,500 | Placer Title Company |
Source: Public Records
Mortgage History
| Date | Status | Borrower | Loan Amount |
|---|---|---|---|
| Previous Owner | Barocio Yesenia | $405,000 |
Source: Public Records
Tax History Compared to Growth
Tax History
| Year | Tax Paid | Tax Assessment Tax Assessment Total Assessment is a certain percentage of the fair market value that is determined by local assessors to be the total taxable value of land and additions on the property. | Land | Improvement |
|---|---|---|---|---|
| 2025 | $6,468 | $551,628 | $183,874 | $367,754 |
| 2024 | $6,468 | $540,813 | $180,269 | $360,544 |
| 2023 | $6,312 | $530,210 | $176,735 | $353,475 |
| 2022 | $6,195 | $519,815 | $173,270 | $346,545 |
| 2021 | $6,069 | $509,623 | $169,873 | $339,750 |
| 2020 | $5,988 | $504,399 | $168,132 | $336,267 |
| 2019 | $5,885 | $494,510 | $164,836 | $329,674 |
| 2018 | $5,734 | $484,814 | $161,604 | $323,210 |
| 2017 | $5,602 | $475,309 | $158,436 | $316,873 |
| 2016 | $5,649 | $465,990 | $155,330 | $310,660 |
| 2015 | $5,506 | $458,991 | $152,997 | $305,994 |
| 2014 | $5,442 | $450,000 | $150,000 | $300,000 |
Source: Public Records
Map
Nearby Homes
- 2016 Clearview Cir
- 117 Sunset Cir Unit 37
- 117 Sunset Cir Unit 36
- 117 Sunset Cir Unit 34
- 112 Inverness Ct
- 132 Chelsea Hills Dr
- 102 Banbury Way
- 543 Sandy Way
- 1893 Shirley Dr
- 1843 Shirley Dr
- 1844 Shirley Dr
- 253 Carlisle Way
- 500 Raymond Dr
- 263 Carlisle Way
- 47 Alta Loma
- 119 Mountview Terrace
- 15 Buena Vista
- 212 Panorama Dr
- 900 Southampton Rd Unit 45
- 900 Southampton Rd Unit 110
- 122 Ardmore Way
- 126 Ardmore Way
- 120 Ardmore Way
- 128 Ardmore Way
- 123 Ardmore Way
- 125 Ardmore Way
- 121 Ardmore Way
- 2288 Clearview Cir
- 2286 Clearview Cir
- 2284 Clearview Cir
- 127 Ardmore Way
- 2282 Clearview Cir
- 118 Ardmore Way
- 2280 Clearview Cir
- 130 Ardmore Way
- 2278 Clearview Cir
- 119 Ardmore Way
- 2290 Clearview Cir
- 2292 Clearview Cir
- 2276 Clearview Cir