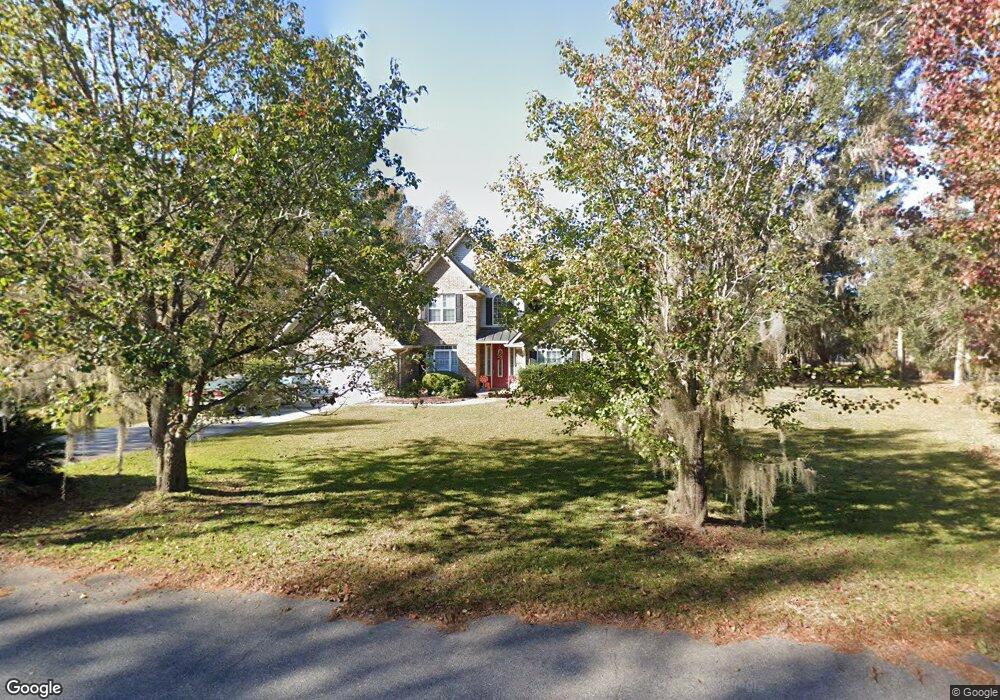
124 Biltmore Dr Guyton, GA 31312
Estimated Value: $485,000 - $532,000
4
Beds
3
Baths
3,081
Sq Ft
$163/Sq Ft
Est. Value
About This Home
This home is located at 124 Biltmore Dr, Guyton, GA 31312 and is currently estimated at $501,299, approximately $162 per square foot. 124 Biltmore Dr is a home located in Effingham County with nearby schools including Guyton Elementary School, Effingham County Middle School, and Effingham County High School.
Ownership History
Date
Name
Owned For
Owner Type
Purchase Details
Closed on
Dec 13, 2019
Sold by
Vanzant Richard D
Bought by
Woods Felicia
Current Estimated Value
Home Financials for this Owner
Home Financials are based on the most recent Mortgage that was taken out on this home.
Original Mortgage
$242,250
Outstanding Balance
$213,084
Interest Rate
3.7%
Mortgage Type
New Conventional
Estimated Equity
$288,215
Purchase Details
Closed on
Feb 13, 2018
Sold by
Vanzant Melva S
Bought by
Vanzant Richard D
Purchase Details
Closed on
Mar 20, 2008
Sold by
Primacy Closing Corp
Bought by
Vanzant Susie M and Vanzant Richard D
Home Financials for this Owner
Home Financials are based on the most recent Mortgage that was taken out on this home.
Original Mortgage
$253,800
Interest Rate
5.97%
Mortgage Type
New Conventional
Purchase Details
Closed on
Jun 7, 2005
Sold by
Abaco Enterprises Inc
Bought by
Bowe Jeffrey R and Bowe Tina J
Home Financials for this Owner
Home Financials are based on the most recent Mortgage that was taken out on this home.
Original Mortgage
$228,000
Interest Rate
4.77%
Mortgage Type
New Conventional
Create a Home Valuation Report for This Property
The Home Valuation Report is an in-depth analysis detailing your home's value as well as a comparison with similar homes in the area
Home Values in the Area
Average Home Value in this Area
Purchase History
| Date | Buyer | Sale Price | Title Company |
|---|---|---|---|
| Woods Felicia | $255,000 | -- | |
| Vanzant Richard D | -- | -- | |
| Vanzant Susie M | $282,000 | -- | |
| Bowe Jeffrey R | $285,000 | -- | |
| Bowe Jeffrey R | $285,000 | -- |
Source: Public Records
Mortgage History
| Date | Status | Borrower | Loan Amount |
|---|---|---|---|
| Open | Woods Felicia | $242,250 | |
| Previous Owner | Vanzant Susie M | $253,800 | |
| Previous Owner | Bowe Jeffrey R | $228,000 |
Source: Public Records
Tax History
| Year | Tax Paid | Tax Assessment Tax Assessment Total Assessment is a certain percentage of the fair market value that is determined by local assessors to be the total taxable value of land and additions on the property. | Land | Improvement |
|---|---|---|---|---|
| 2025 | $6,201 | $194,112 | $30,000 | $164,112 |
| 2024 | $6,201 | $183,691 | $30,000 | $153,691 |
| 2023 | $4,857 | $171,091 | $26,000 | $145,091 |
| 2022 | $4,944 | $160,251 | $15,160 | $145,091 |
| 2021 | $4,483 | $141,448 | $15,000 | $126,448 |
| 2020 | $3,270 | $133,520 | $13,960 | $119,560 |
| 2019 | $3,844 | $130,360 | $10,800 | $119,560 |
| 2018 | $3,598 | $122,443 | $12,000 | $110,443 |
| 2017 | $3,618 | $122,443 | $12,000 | $110,443 |
| 2016 | $3,591 | $125,415 | $17,000 | $108,415 |
| 2015 | -- | $120,415 | $12,000 | $108,415 |
| 2014 | -- | $111,615 | $3,200 | $108,415 |
| 2013 | -- | $113,414 | $5,000 | $108,414 |
Source: Public Records
Map
Nearby Homes
- 330 Central Ave
- 210 Glick Way
- 213 Glick Way
- 111 Concord Dr
- 102 Concord Dr
- 0 Magnolia Unit SA347200
- 0 Dean Dr Unit SA345091
- 0 Dean Dr Unit 10694953
- 1836-A Georgia 17
- 0 Highway 119 S Unit SA339898
- 357 Pound Rd
- 233 Caroline Way
- 216 Caroline Way
- 301 Church St
- 3788 Georgia 119
- 2 Farrington Ct
- 4 Farrington Ct
- 72 Oakmont Dr
- 0 Ralph Rahn Rd Unit 329204
- 222 Candleberry Way
- 126 Biltmore Dr
- 2 Live Oak Trail
- 125 Biltmore Dr
- 122 Biltmore Dr
- 20 S Camellia Ct
- 30 S Camellia Ct
- 1 Live Oak Trail
- 4 Live Oak Trail
- 123 Biltmore Dr
- 123 Biltmore Dr Unit 34
- 127 Biltmore Dr
- 3 Live Oak Trail
- 120 Biltmore Dr
- 130 Biltmore Dr
- 19 S Camellia Ct
- 2 Azalea Dr
- 6 Live Oak Trail
- 103 Biltmore Dr
- 121 Biltmore Dr
Your Personal Tour Guide
Ask me questions while you tour the home.