Estimated Value: $408,000 - $476,000
2
Beds
1
Bath
1,356
Sq Ft
$320/Sq Ft
Est. Value
About This Home
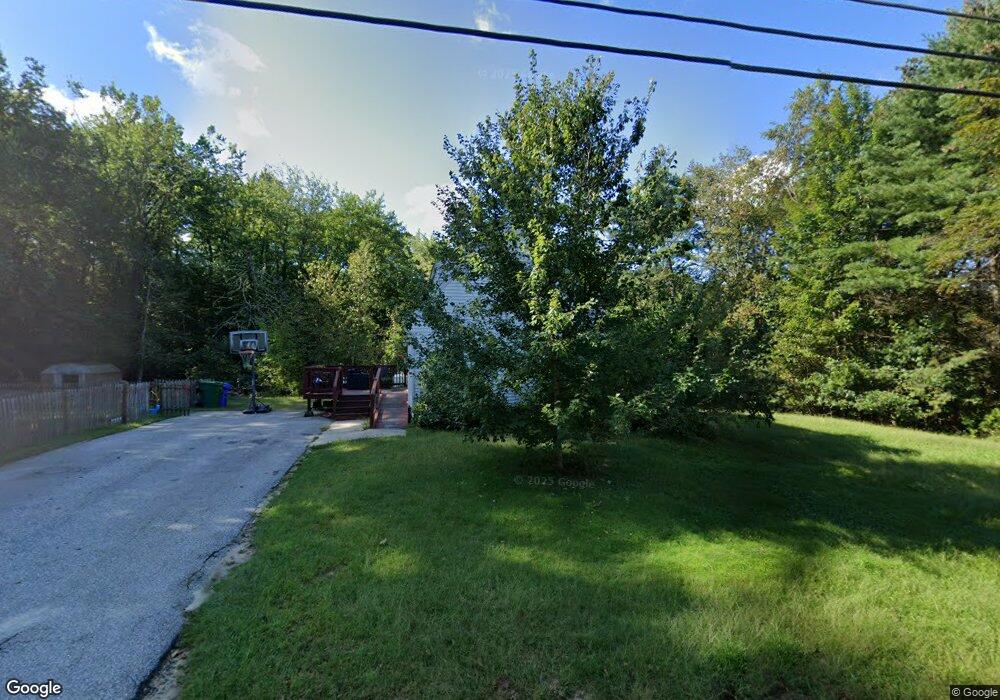
This home is located at 124 Bow Bog Rd, Bow, NH 03304 and is currently estimated at $434,465, approximately $320 per square foot. 124 Bow Bog Rd is a home located in Merrimack County with nearby schools including Bow Elementary School, Bow Memorial School, and Bow High School.
Ownership History
Date
Name
Owned For
Owner Type
Purchase Details
Closed on
Mar 10, 2016
Sold by
Madden Glenda L
Bought by
Richards Jeffrey A and Richards Cassandra
Current Estimated Value
Home Financials for this Owner
Home Financials are based on the most recent Mortgage that was taken out on this home.
Original Mortgage
$131,200
Outstanding Balance
$102,910
Interest Rate
3.79%
Mortgage Type
Purchase Money Mortgage
Estimated Equity
$331,555
Create a Home Valuation Report for This Property
The Home Valuation Report is an in-depth analysis detailing your home's value as well as a comparison with similar homes in the area
Home Values in the Area
Average Home Value in this Area
Purchase History
| Date | Buyer | Sale Price | Title Company |
|---|---|---|---|
| Richards Jeffrey A | $164,000 | -- |
Source: Public Records
Mortgage History
| Date | Status | Borrower | Loan Amount |
|---|---|---|---|
| Open | Richards Jeffrey A | $131,200 |
Source: Public Records
Tax History
| Year | Tax Paid | Tax Assessment Tax Assessment Total Assessment is a certain percentage of the fair market value that is determined by local assessors to be the total taxable value of land and additions on the property. | Land | Improvement |
|---|---|---|---|---|
| 2025 | $6,244 | $311,400 | $117,800 | $193,600 |
| 2024 | $6,159 | $311,400 | $117,800 | $193,600 |
| 2023 | $6,015 | $216,300 | $85,400 | $130,900 |
| 2022 | $5,736 | $216,300 | $85,400 | $130,900 |
| 2021 | $5,513 | $216,300 | $85,400 | $130,900 |
| 2020 | $5,206 | $203,500 | $85,400 | $118,100 |
| 2019 | $5,334 | $203,500 | $85,400 | $118,100 |
| 2018 | $4,820 | $173,500 | $73,600 | $99,900 |
| 2017 | $4,818 | $173,500 | $73,600 | $99,900 |
| 2016 | $4,561 | $173,500 | $73,600 | $99,900 |
| 2015 | $4,589 | $160,800 | $73,600 | $87,200 |
| 2014 | $4,745 | $160,800 | $73,600 | $87,200 |
| 2011 | $4,292 | $158,100 | $73,600 | $84,500 |
Source: Public Records
Map
Nearby Homes
- 7 Morgan Dr
- 17 Erin Dr
- 42 Westover Ln
- 3 Abbey Rd
- 47 Bog Rd Unit G2
- 2 Brandywine Dr
- 15 Clearview Dr
- 117 Merrimack St
- 131 Merrimack St
- 104 White Rock Hill Rd
- 29 S Bow Dunbarton Rd
- 12 Chase St
- 7 Oak St
- 14 High St
- 100 Main St Unit 108
- 100 Main St Unit 203
- 135 Main St
- 8 Central St
- 26 Jonathan Ln
- 8 Park St
Your Personal Tour Guide
Ask me questions while you tour the home.