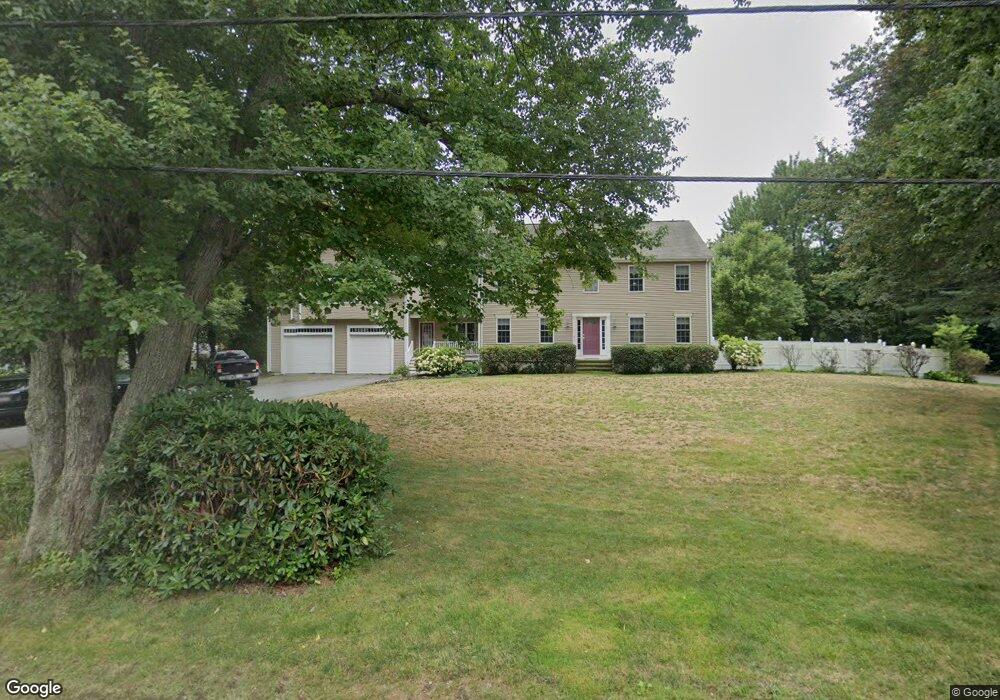
124 Cedar St Hanover, MA 02339
Estimated Value: $709,000 - $1,361,000
3
Beds
1
Bath
1,405
Sq Ft
$778/Sq Ft
Est. Value
About This Home
This home is located at 124 Cedar St, Hanover, MA 02339 and is currently estimated at $1,093,166, approximately $778 per square foot. 124 Cedar St is a home located in Plymouth County with nearby schools including Hanover High School, Cadence Academy Preschool - Hanover, and The Master's Academy.
Ownership History
Date
Name
Owned For
Owner Type
Purchase Details
Closed on
Aug 31, 2001
Sold by
Nichols Scott R
Bought by
Odowd Richard C and Odowd Rebecca S
Current Estimated Value
Purchase Details
Closed on
Nov 22, 1999
Sold by
Devine Robert E and Devine Marie E
Bought by
Nichols Scott R
Create a Home Valuation Report for This Property
The Home Valuation Report is an in-depth analysis detailing your home's value as well as a comparison with similar homes in the area
Home Values in the Area
Average Home Value in this Area
Purchase History
| Date | Buyer | Sale Price | Title Company |
|---|---|---|---|
| Odowd Richard C | $230,000 | -- | |
| Nichols Scott R | $199,900 | -- |
Source: Public Records
Mortgage History
| Date | Status | Borrower | Loan Amount |
|---|---|---|---|
| Open | Nichols Scott R | $160,000 | |
| Closed | Nichols Scott R | $104,800 |
Source: Public Records
Tax History
| Year | Tax Paid | Tax Assessment Tax Assessment Total Assessment is a certain percentage of the fair market value that is determined by local assessors to be the total taxable value of land and additions on the property. | Land | Improvement |
|---|---|---|---|---|
| 2025 | $13,034 | $1,055,400 | $271,800 | $783,600 |
| 2024 | $12,561 | $978,300 | $271,800 | $706,500 |
| 2023 | $12,285 | $910,700 | $247,100 | $663,600 |
| 2022 | $12,179 | $798,600 | $234,700 | $563,900 |
| 2021 | $7,117 | $712,600 | $191,300 | $521,300 |
| 2020 | $11,420 | $700,200 | $202,500 | $497,700 |
| 2019 | $10,947 | $667,100 | $202,500 | $464,600 |
| 2018 | $10,094 | $620,000 | $202,500 | $417,500 |
| 2017 | $6,401 | $619,300 | $203,500 | $415,800 |
| 2016 | $9,964 | $591,000 | $184,900 | $406,100 |
| 2015 | $9,325 | $577,400 | $171,300 | $406,100 |
Source: Public Records
Map
Nearby Homes
- 506 Main St
- 776 Main St
- 44 Stone Meadow Ln
- 47 Stone Meadow Ln
- 62 Larchmont Ln
- 36 Bayberry Ln
- 53 Chestnut St
- 73 Shingle Mill Ln
- 36 Grove St
- 535 Webster St
- 561 Circuit St
- 46 Brookwood Rd
- 250 Center St
- 51 Cervelli Farm Dr
- 37 Dr
- 23 Cervelli Farm Dr
- 38 Cervelli Farm Dr
- 9 Cervelli Farm Dr
- 75 School St
- 50 Village Ln
Your Personal Tour Guide
Ask me questions while you tour the home.