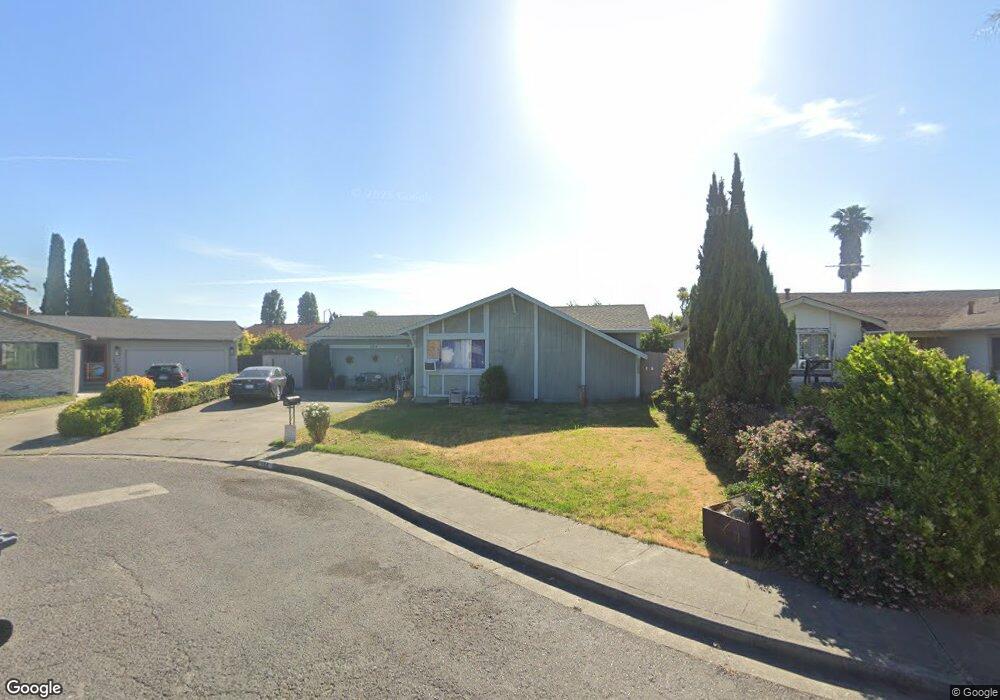
124 Coloma Way Vallejo, CA 94589
North Vallejo NeighborhoodEstimated Value: $418,000 - $454,000
4
Beds
2
Baths
1,528
Sq Ft
$286/Sq Ft
Est. Value
About This Home
This home is located at 124 Coloma Way, Vallejo, CA 94589 and is currently estimated at $437,411, approximately $286 per square foot. 124 Coloma Way is a home located in Solano County with nearby schools including Dan Mini Elementary School, Solano Middle School, and Vallejo High School.
Ownership History
Date
Name
Owned For
Owner Type
Purchase Details
Closed on
Sep 1, 2016
Sold by
Blankenship Steven and Blankenship Steve
Bought by
Blankenship Steven
Current Estimated Value
Home Financials for this Owner
Home Financials are based on the most recent Mortgage that was taken out on this home.
Original Mortgage
$122,000
Outstanding Balance
$97,449
Interest Rate
3.43%
Mortgage Type
New Conventional
Estimated Equity
$339,962
Purchase Details
Closed on
Oct 27, 2008
Sold by
Wachovia Mortgage Fsb
Bought by
Blankenship Steve
Home Financials for this Owner
Home Financials are based on the most recent Mortgage that was taken out on this home.
Original Mortgage
$142,373
Interest Rate
6.47%
Mortgage Type
FHA
Purchase Details
Closed on
Sep 3, 2008
Sold by
Singleton Lois M and Singleton Alphonso
Bought by
Wachovia Entity
Home Financials for this Owner
Home Financials are based on the most recent Mortgage that was taken out on this home.
Original Mortgage
$142,373
Interest Rate
6.47%
Mortgage Type
FHA
Create a Home Valuation Report for This Property
The Home Valuation Report is an in-depth analysis detailing your home's value as well as a comparison with similar homes in the area
Home Values in the Area
Average Home Value in this Area
Purchase History
| Date | Buyer | Sale Price | Title Company |
|---|---|---|---|
| Blankenship Steven | -- | North American Title Co Inc | |
| Blankenship Steve | $145,000 | Fidelity National Title Co | |
| Wachovia Entity | $133,500 | None Available |
Source: Public Records
Mortgage History
| Date | Status | Borrower | Loan Amount |
|---|---|---|---|
| Open | Blankenship Steven | $122,000 | |
| Previous Owner | Blankenship Steve | $142,373 |
Source: Public Records
Tax History
| Year | Tax Paid | Tax Assessment Tax Assessment Total Assessment is a certain percentage of the fair market value that is determined by local assessors to be the total taxable value of land and additions on the property. | Land | Improvement |
|---|---|---|---|---|
| 2025 | $3,121 | $186,714 | $51,503 | $135,211 |
| 2024 | $3,121 | $183,054 | $50,494 | $132,560 |
| 2023 | $2,910 | $179,465 | $49,504 | $129,961 |
| 2022 | $2,804 | $175,947 | $48,534 | $127,413 |
| 2021 | $2,740 | $172,498 | $47,583 | $124,915 |
| 2020 | $2,736 | $170,731 | $47,096 | $123,635 |
| 2019 | $2,638 | $167,384 | $46,173 | $121,211 |
| 2018 | $2,458 | $164,103 | $45,268 | $118,835 |
| 2017 | $2,334 | $160,886 | $44,381 | $116,505 |
| 2016 | $1,762 | $157,732 | $43,511 | $114,221 |
| 2015 | $1,738 | $155,364 | $42,858 | $112,506 |
| 2014 | $1,713 | $152,322 | $42,019 | $110,303 |
Source: Public Records
Map
Nearby Homes
- 1335 Jack London Dr
- 1355 Jack London Dr
- 130 Kennison Ct
- 148 Obrien Cir
- 552 Cattail Ct
- 568 Cattail Ct
- 1001 Jack London Dr
- 316 Meadows Dr
- 570 Newport Way
- 1537 Mini Dr
- 240 Rinaldo Dr
- 35 Marla Dr
- 121 Forsythia Ct
- 601 Danrose Dr
- 446 Kensington Way
- 705 Danrose Dr
- 116 Bret Harte Way
- 203 Baylor Dr Unit 11
- 141 Dartmouth Ave
- 151 Marquette Ave
- 120 Coloma Way
- 128 Coloma Way
- 1265 Jack London Dr
- 1255 Jack London Dr
- 116 Coloma Way
- 132 Coloma Way
- 1275 Jack London Dr
- 1245 Jack London Dr
- 131 Coloma Way
- 1235 Jack London Dr
- 1285 Jack London Dr
- 1285 Jack London Dr Unit 3
- 112 Coloma Way
- 136 Coloma Way
- 197 River Pines Way
- 117 Coloma Way
- 1225 Jack London Dr
- 1289 Jack London Dr
- 137 Coloma Way
- 113 Coloma Way
Your Personal Tour Guide
Ask me questions while you tour the home.