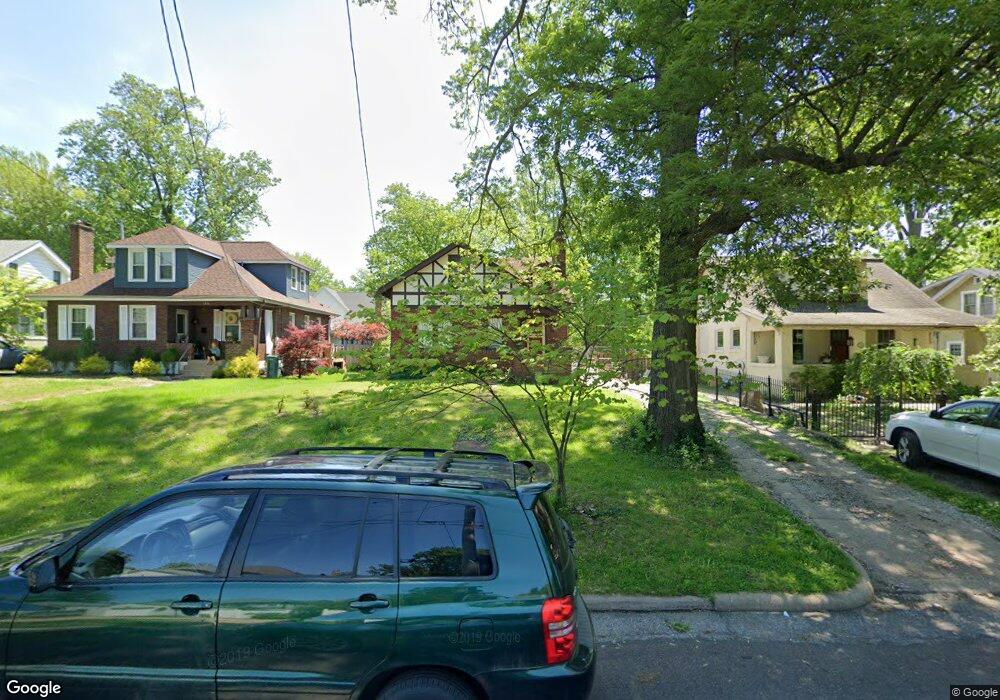
124 Dickson St Saint Louis, MO 63122
Estimated Value: $302,000 - $413,000
3
Beds
1
Bath
872
Sq Ft
$421/Sq Ft
Est. Value
About This Home
This home is located at 124 Dickson St, Saint Louis, MO 63122 and is currently estimated at $366,679, approximately $420 per square foot. 124 Dickson St is a home located in St. Louis County with nearby schools including F.P. Tillman Elementary School, Nipher Middle School, and Kirkwood Senior High School.
Ownership History
Date
Name
Owned For
Owner Type
Purchase Details
Closed on
Jun 13, 2025
Sold by
Vandyke Jennifer A
Bought by
Burnside David W
Current Estimated Value
Purchase Details
Closed on
Jan 27, 2025
Sold by
Burnside David W
Bought by
Vandyke Jennifer A
Purchase Details
Closed on
Jun 26, 2013
Sold by
Fitzgerald Michael Sean and Fitzgerald Jennifer
Bought by
Fitzgerald Michael Sean and Fitzgerald Jennifer
Purchase Details
Closed on
Feb 28, 2012
Sold by
Fitzgerald Michael Sean and Junker Jennifer Fitzgerald
Bought by
Fitzgerald Michael Sean and Junker Jennifer Fitzgerald
Purchase Details
Closed on
Jun 1, 2011
Sold by
Fitzgerald Family Revocable Trust
Bought by
Burnside David Wayne and Burnside Jennifer Ann
Purchase Details
Closed on
Mar 5, 2010
Sold by
Fitzgerald Veta A
Bought by
Fitzgerald Michael Sean and Junker Jennifer Fitzgerald
Create a Home Valuation Report for This Property
The Home Valuation Report is an in-depth analysis detailing your home's value as well as a comparison with similar homes in the area
Home Values in the Area
Average Home Value in this Area
Purchase History
| Date | Buyer | Sale Price | Title Company |
|---|---|---|---|
| Burnside David W | -- | None Listed On Document | |
| Vandyke Jennifer A | -- | None Listed On Document | |
| Fitzgerald Michael Sean | -- | None Available | |
| Fitzgerald Michael Sean | -- | None Available | |
| Burnside David Wayne | $145,000 | None Available | |
| Fitzgerald Michael Sean | -- | None Available |
Source: Public Records
Tax History
| Year | Tax Paid | Tax Assessment Tax Assessment Total Assessment is a certain percentage of the fair market value that is determined by local assessors to be the total taxable value of land and additions on the property. | Land | Improvement |
|---|---|---|---|---|
| 2025 | $5,064 | $99,130 | $77,200 | $21,930 |
| 2024 | $5,064 | $80,730 | $69,460 | $11,270 |
| 2023 | $5,064 | $80,730 | $69,460 | $11,270 |
| 2022 | $3,701 | $51,590 | $51,550 | $40 |
| 2021 | $3,348 | $72,300 | $61,750 | $10,550 |
| 2020 | $2,418 | $35,720 | $25,500 | $10,220 |
| 2019 | $2,443 | $35,720 | $25,500 | $10,220 |
| 2018 | $1,555 | $19,950 | $19,910 | $40 |
| 2017 | $1,553 | $19,950 | $19,910 | $40 |
| 2016 | $1,541 | $19,950 | $19,760 | $190 |
| 2015 | $1,539 | $19,950 | $19,760 | $190 |
| 2014 | $1,649 | $20,940 | $15,540 | $5,400 |
Source: Public Records
Map
Nearby Homes
- 534 E Jefferson Ave
- 430 E Jefferson Ave
- 412 Hawbrook Ct
- 683 Hawbrook Ave
- 106 S Brent Ave
- 306 E Jefferson Ave
- 231 E Argonne Dr
- 361 E Bodley Ave
- 938 Hawbrook Rd
- 132 E Monroe Ave Unit C-103
- 132 E Monroe Ave Unit 211
- 132 E Monroe Ave Unit E-106
- 132 E Monroe Ave Unit C-307
- 132 E Monroe Ave Unit 305
- 132 E Monroe Ave Unit 302
- 132 E Monroe Ave Unit 308
- 132 E Monroe Ave Unit 212
- 132 E Monroe Ave Unit A-102
- 132 E Monroe Ave Unit D-311
- 132 E Monroe Ave Unit 201
- 126 Dickson St
- 120 Dickson St
- 128 Dickson St
- 116 Dickson St
- 610 E Jefferson Ave
- 112 Dickson St
- 620 E Jefferson Ave
- 554 E Jefferson Ave
- 110 Dickson St
- 622 E Jefferson Ave
- 113 Handlan Ct
- 123 Dickson St
- 109 Handlan Ct
- 119 Dickson St
- 548 E Jefferson Ave
- 106 Dickson St
- 109 Dickson St
- 105 Handlan Ct
- 601 E Jefferson Ave
- 611 E Jefferson Ave
Your Personal Tour Guide
Ask me questions while you tour the home.