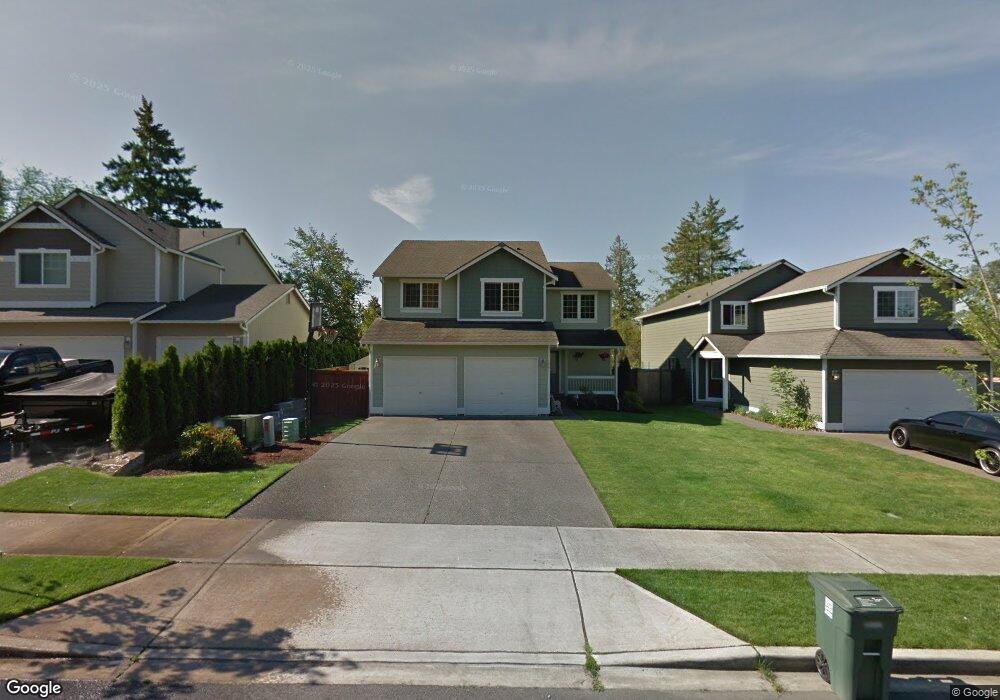
124 E 91st St Tacoma, WA 98445
South End NeighborhoodEstimated Value: $566,292 - $609,000
5
Beds
3
Baths
2,110
Sq Ft
$278/Sq Ft
Est. Value
About This Home
This home is located at 124 E 91st St, Tacoma, WA 98445 and is currently estimated at $586,323, approximately $277 per square foot. 124 E 91st St is a home located in Pierce County with nearby schools including Larchmont Elementary School, Baker Middle School, and Mount Tahoma High School.
Ownership History
Date
Name
Owned For
Owner Type
Purchase Details
Closed on
Mar 24, 2008
Sold by
Sager Construction Inc
Bought by
Alexander Dion L and Alexander Jennifer A
Current Estimated Value
Home Financials for this Owner
Home Financials are based on the most recent Mortgage that was taken out on this home.
Original Mortgage
$273,999
Outstanding Balance
$170,514
Interest Rate
5.72%
Mortgage Type
FHA
Estimated Equity
$415,809
Create a Home Valuation Report for This Property
The Home Valuation Report is an in-depth analysis detailing your home's value as well as a comparison with similar homes in the area
Home Values in the Area
Average Home Value in this Area
Purchase History
| Date | Buyer | Sale Price | Title Company |
|---|---|---|---|
| Alexander Dion L | $299,950 | Rainier |
Source: Public Records
Mortgage History
| Date | Status | Borrower | Loan Amount |
|---|---|---|---|
| Open | Alexander Dion L | $273,999 |
Source: Public Records
Tax History Compared to Growth
Tax History
| Year | Tax Paid | Tax Assessment Tax Assessment Total Assessment is a certain percentage of the fair market value that is determined by local assessors to be the total taxable value of land and additions on the property. | Land | Improvement |
|---|---|---|---|---|
| 2025 | $5,421 | $533,500 | $163,700 | $369,800 |
| 2024 | $5,421 | $530,700 | $165,400 | $365,300 |
| 2023 | $5,421 | $487,000 | $158,600 | $328,400 |
| 2022 | $4,971 | $514,300 | $148,700 | $365,600 |
| 2021 | $4,608 | $366,600 | $97,500 | $269,100 |
| 2019 | $4,053 | $340,200 | $83,400 | $256,800 |
| 2018 | $4,399 | $311,900 | $67,700 | $244,200 |
| 2017 | $3,877 | $278,500 | $50,500 | $228,000 |
| 2016 | $3,423 | $212,100 | $38,100 | $174,000 |
| 2014 | $2,756 | $196,900 | $37,000 | $159,900 |
| 2013 | $2,756 | $170,700 | $31,400 | $139,300 |
Source: Public Records
Map
Nearby Homes