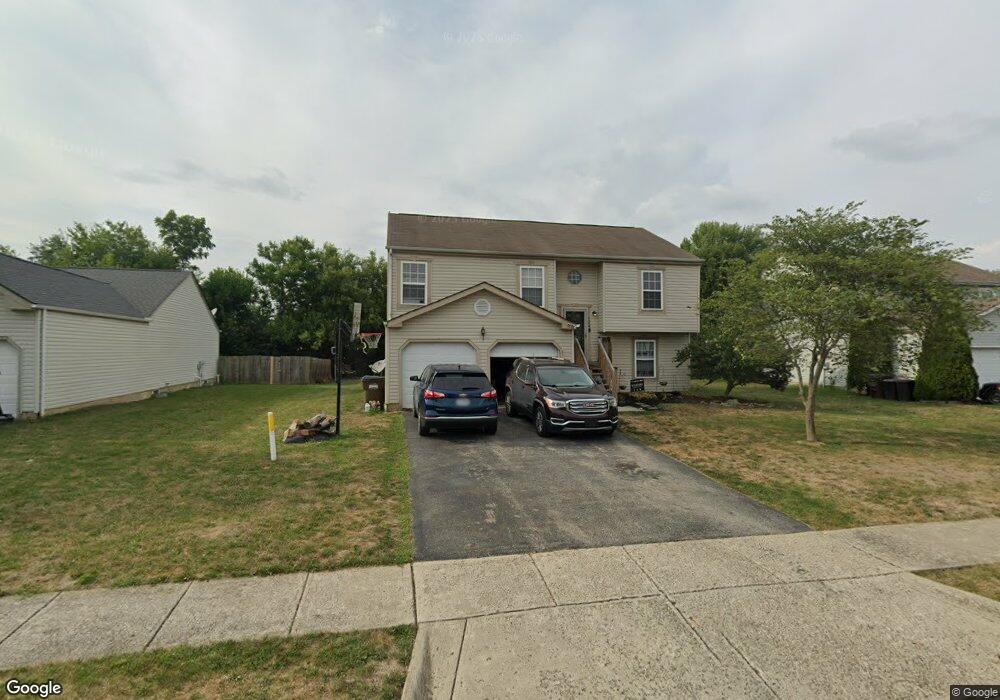
124 Edmonds Dr Commercial Point, OH 43116
Estimated Value: $350,000 - $366,000
4
Beds
3
Baths
2,104
Sq Ft
$171/Sq Ft
Est. Value
About This Home
This home is located at 124 Edmonds Dr, Commercial Point, OH 43116 and is currently estimated at $359,750, approximately $170 per square foot. 124 Edmonds Dr is a home located in Pickaway County.
Ownership History
Date
Name
Owned For
Owner Type
Purchase Details
Closed on
Aug 13, 2009
Sold by
Secretary Of Housing & Urban Development
Bought by
Carte Shawn
Current Estimated Value
Home Financials for this Owner
Home Financials are based on the most recent Mortgage that was taken out on this home.
Original Mortgage
$106,735
Outstanding Balance
$69,840
Interest Rate
5.28%
Mortgage Type
FHA
Estimated Equity
$289,910
Purchase Details
Closed on
Apr 3, 2009
Sold by
Wells Fargo Bank Na
Bought by
Secretary Of Housing & Urban Development
Purchase Details
Closed on
Feb 9, 2009
Sold by
Gilligan Steven P and Case #2007Ci346
Bought by
Wells Fargo Bank Na
Purchase Details
Closed on
Jul 30, 2004
Sold by
Maronda Homes Inc Of Ohio
Bought by
Gilligan Steven P and Gilligan Pamela M
Home Financials for this Owner
Home Financials are based on the most recent Mortgage that was taken out on this home.
Original Mortgage
$129,615
Interest Rate
6.34%
Mortgage Type
FHA
Create a Home Valuation Report for This Property
The Home Valuation Report is an in-depth analysis detailing your home's value as well as a comparison with similar homes in the area
Home Values in the Area
Average Home Value in this Area
Purchase History
| Date | Buyer | Sale Price | Title Company |
|---|---|---|---|
| Carte Shawn | $105,000 | Lakeside Title & Escrow | |
| Secretary Of Housing & Urban Development | -- | None Available | |
| Wells Fargo Bank Na | $101,334 | None Available | |
| Gilligan Steven P | $131,700 | Chicago Title |
Source: Public Records
Mortgage History
| Date | Status | Borrower | Loan Amount |
|---|---|---|---|
| Open | Carte Shawn | $106,735 | |
| Previous Owner | Gilligan Steven P | $129,615 |
Source: Public Records
Tax History Compared to Growth
Tax History
| Year | Tax Paid | Tax Assessment Tax Assessment Total Assessment is a certain percentage of the fair market value that is determined by local assessors to be the total taxable value of land and additions on the property. | Land | Improvement |
|---|---|---|---|---|
| 2024 | -- | $80,920 | $16,020 | $64,900 |
| 2023 | $3,044 | $80,920 | $16,020 | $64,900 |
| 2022 | $2,635 | $64,350 | $13,350 | $51,000 |
| 2021 | $2,643 | $64,350 | $13,350 | $51,000 |
| 2020 | $2,643 | $64,350 | $13,350 | $51,000 |
| 2019 | $2,162 | $55,370 | $13,350 | $42,020 |
| 2018 | $2,158 | $55,370 | $13,350 | $42,020 |
| 2017 | $2,214 | $55,370 | $13,350 | $42,020 |
| 2016 | $1,982 | $49,460 | $10,200 | $39,260 |
| 2015 | $1,984 | $49,460 | $10,200 | $39,260 |
| 2014 | $1,986 | $49,460 | $10,200 | $39,260 |
| 2013 | $2,168 | $51,910 | $10,200 | $41,710 |
Source: Public Records
Map
Nearby Homes
- 201 Victorian Dr
- 229 Victorian Dr
- 317 Adrien Ct
- 49 Front St
- 403 Alberta Dr
- 502 Conley Dr
- 513 Heidish Dr
- 211 Cavanaugh Dr
- 500 Walker Pointe Dr
- 486 Creekside Dr
- 56 Chambers Bay Rd
- 294 Shady Hollow Dr
- 47 Front St
- 45 Genoa Cir
- 55 Genoa Cir
- 62 Genoa Cir
- 66 Genoa Cir
- 310 Genoa Rd
- 10901 Borror Rd Unit 19
- 428 Lockbay Rd
- 122 Edmonds Dr
- 126 Edmonds Dr
- 120 Edmonds Dr
- 128 Edmonds Dr
- 3 Beckman Ln
- 130 Brittney Rd
- 123 Edmonds Dr
- 130 Edmonds Dr
- 118 Edmonds Dr
- 121 Edmonds Dr
- 128 Brittney Rd
- 132 Edmonds Dr
- 116 Edmonds Dr
- 131 Brittney Rd
- 119 Edmonds Dr
- 120 Brittney Rd
- 31 E Scioto St
- 134 Edmonds Dr
- 114 Edmonds Dr
- 129 Brittney Rd