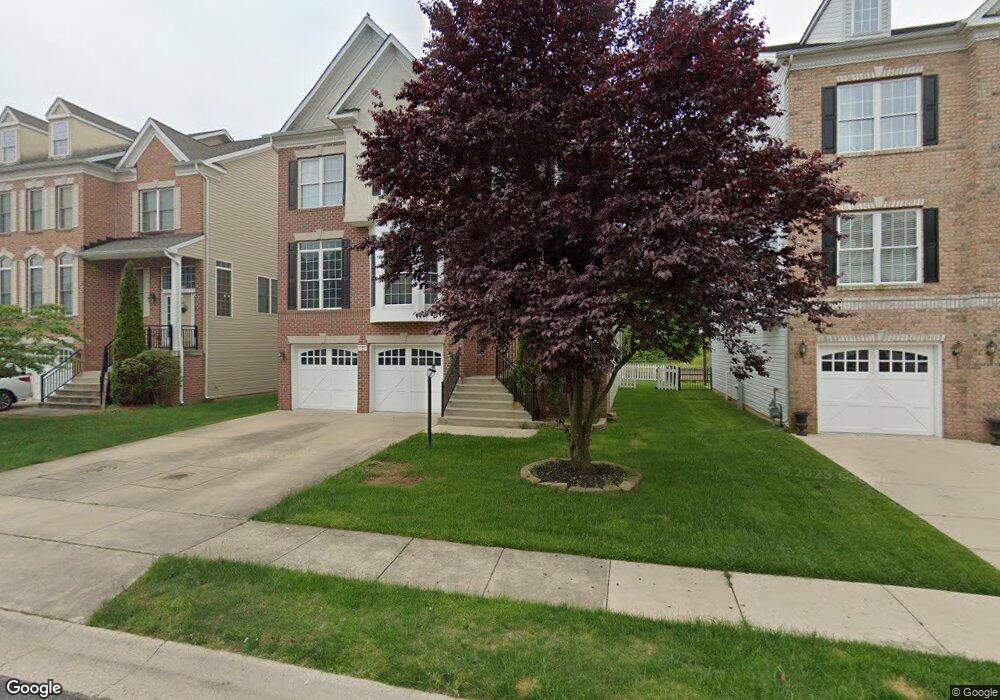
124 Fallston Meadow Ct Fallston, MD 21047
Estimated Value: $640,410 - $732,000
4
Beds
4
Baths
2,980
Sq Ft
$226/Sq Ft
Est. Value
About This Home
This home is located at 124 Fallston Meadow Ct, Fallston, MD 21047 and is currently estimated at $673,103, approximately $225 per square foot. 124 Fallston Meadow Ct is a home located in Harford County with nearby schools including Youths Benefit Elementary School, Fallston Middle School, and Fallston High School.
Ownership History
Date
Name
Owned For
Owner Type
Purchase Details
Closed on
Aug 18, 2025
Sold by
Jones Gloria N and Kuna Gloria N
Bought by
Kuna Gloria N and Kuna Moses S
Current Estimated Value
Home Financials for this Owner
Home Financials are based on the most recent Mortgage that was taken out on this home.
Original Mortgage
$235,000
Outstanding Balance
$234,186
Interest Rate
5.92%
Mortgage Type
New Conventional
Estimated Equity
$438,917
Purchase Details
Closed on
Feb 25, 2010
Sold by
Hsbc Bank Usa National
Bought by
Jones Gloria N
Purchase Details
Closed on
Jun 5, 2009
Sold by
Johnson Tangela R
Bought by
Hsbc Bank Usa National and Association
Purchase Details
Closed on
Dec 10, 2004
Sold by
B & Rews & Co Inc
Bought by
Johnson Tangela R
Create a Home Valuation Report for This Property
The Home Valuation Report is an in-depth analysis detailing your home's value as well as a comparison with similar homes in the area
Home Values in the Area
Average Home Value in this Area
Purchase History
| Date | Buyer | Sale Price | Title Company |
|---|---|---|---|
| Kuna Gloria N | -- | Navy Federal Title | |
| Jones Gloria N | $360,000 | -- | |
| Hsbc Bank Usa National | $311,600 | -- | |
| Johnson Tangela R | $448,386 | -- |
Source: Public Records
Mortgage History
| Date | Status | Borrower | Loan Amount |
|---|---|---|---|
| Open | Kuna Gloria N | $235,000 | |
| Closed | Jones Gloria N | -- |
Source: Public Records
Tax History
| Year | Tax Paid | Tax Assessment Tax Assessment Total Assessment is a certain percentage of the fair market value that is determined by local assessors to be the total taxable value of land and additions on the property. | Land | Improvement |
|---|---|---|---|---|
| 2025 | $5,277 | $516,400 | $130,000 | $386,400 |
| 2024 | $5,277 | $490,433 | $0 | $0 |
| 2023 | $5,023 | $464,467 | $0 | $0 |
| 2022 | $4,779 | $438,500 | $130,000 | $308,500 |
| 2021 | $4,916 | $432,267 | $0 | $0 |
| 2020 | $4,916 | $426,033 | $0 | $0 |
| 2019 | $4,845 | $419,800 | $110,000 | $309,800 |
| 2018 | $4,712 | $412,000 | $0 | $0 |
| 2017 | $4,622 | $419,800 | $0 | $0 |
| 2016 | $140 | $396,400 | $0 | $0 |
| 2015 | $4,276 | $384,833 | $0 | $0 |
| 2014 | $4,276 | $373,267 | $0 | $0 |
Source: Public Records
Map
Nearby Homes
- 305 Tufton Cir
- 2015 Margrave Ave
- 309 Lennox Dr
- 313 Lennox Dr
- 371 Tufton Cir
- 331 Tufton Cir Unit 102
- 2511 Easy St
- 812 Old Joppa Rd
- 803 Karylou Cir
- 0 Hollingsworth Rd
- 700 Remington Rd
- 818 Old Joppa Rd
- 820 Old Joppa Rd
- 0 Winter Park Rd
- 1319 Martin Meadows Dr
- 1115 Stromko Dr
- 603 Deep Ridge Rd
- 702 Deep Ridge Rd
- 710 Iron Gate Rd
- 605 Buggy Ride Rd
- 122 Fallston Meadow Ct
- 126 Fallston Meadow Ct
- 120 Fallston Meadow Ct
- 128 Fallston Meadow Ct
- 121 Fallston Meadow Ct
- 119 Fallston Meadow Ct
- 118 Fallston Meadow Ct
- 123 Fallston Meadow Ct
- 117 Fallston Meadow Ct
- 125 Fallston Meadow Ct
- 115 Fallston Meadow Ct
- 116 Fallston Meadow Ct
- 127 Fallston Meadow Ct
- 113 Fallston Meadow Ct
- 122 Milton Ave
- 114 Meadow Rd
- 120 Milton Ave
- 114 Fallston Meadow Ct
- 124 Milton Ave
- 118 Milton Ave
Your Personal Tour Guide
Ask me questions while you tour the home.