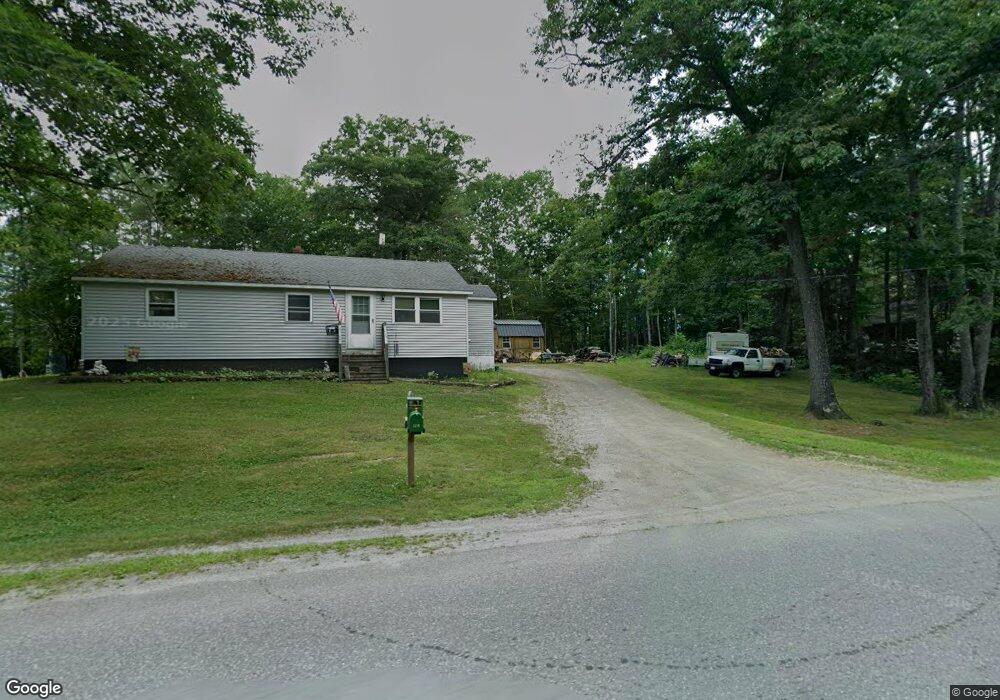
124 Hanscom Rd Benton, ME 04901
Estimated Value: $183,115 - $232,000
Studio
--
Bath
--
Sq Ft
43,560
Sq Ft
About This Home
This home is located at 124 Hanscom Rd, Benton, ME 04901 and is currently estimated at $208,279. 124 Hanscom Rd is a home with nearby schools including Lawrence High School.
Ownership History
Date
Name
Owned For
Owner Type
Purchase Details
Closed on
Sep 6, 2018
Sold by
Robinson Joseph I
Bought by
Robinson Anne M
Current Estimated Value
Home Financials for this Owner
Home Financials are based on the most recent Mortgage that was taken out on this home.
Original Mortgage
$72,000
Interest Rate
4.5%
Mortgage Type
Unknown
Purchase Details
Closed on
Aug 14, 2015
Sold by
Robinson Joseph I
Bought by
Robinson Joseph I and Robinson Anne M
Home Financials for this Owner
Home Financials are based on the most recent Mortgage that was taken out on this home.
Original Mortgage
$50,000
Interest Rate
4.08%
Mortgage Type
Commercial
Create a Home Valuation Report for This Property
The Home Valuation Report is an in-depth analysis detailing your home's value as well as a comparison with similar homes in the area
Home Values in the Area
Average Home Value in this Area
Purchase History
| Date | Buyer | Sale Price | Title Company |
|---|---|---|---|
| Robinson Anne M | -- | -- | |
| Robinson Joseph I | -- | -- |
Source: Public Records
Mortgage History
| Date | Status | Borrower | Loan Amount |
|---|---|---|---|
| Closed | Robinson Anne M | $72,000 | |
| Closed | Robinson Joseph I | $50,000 |
Source: Public Records
Tax History
| Year | Tax Paid | Tax Assessment Tax Assessment Total Assessment is a certain percentage of the fair market value that is determined by local assessors to be the total taxable value of land and additions on the property. | Land | Improvement |
|---|---|---|---|---|
| 2025 | $1,670 | $119,250 | $33,000 | $86,250 |
| 2024 | $1,729 | $119,250 | $33,000 | $86,250 |
| 2023 | $1,538 | $119,250 | $33,000 | $86,250 |
| 2022 | $1,550 | $119,250 | $33,000 | $86,250 |
| 2021 | $1,478 | $83,050 | $25,000 | $58,050 |
| 2020 | $1,304 | $83,050 | $25,000 | $58,050 |
| 2019 | $1,254 | $83,050 | $25,000 | $58,050 |
| 2018 | $1,213 | $83,050 | $25,000 | $58,050 |
| 2017 | $1,196 | $83,050 | $25,000 | $58,050 |
| 2016 | $1,138 | $83,050 | $25,000 | $58,050 |
| 2015 | $1,093 | $80,990 | $25,000 | $55,990 |
| 2014 | $1,101 | $80,990 | $25,000 | $55,990 |
| 2013 | -- | $80,990 | $25,000 | $55,990 |
Source: Public Records
Map
Nearby Homes
- 301 Unity Rd
- 595 Bangor Rd
- 158 Pleasant St
- 28 Sebasticook Dr
- Lot 44 Bangor Rd
- M18Lot 11 Main St
- 21 Water St
- 151 Bangor Rd
- 156 Railroad St
- 323 Neck Rd
- 110 Hill Rd
- 17 Main St
- 653 Abbott Rd
- 137 China Rd
- 141 Albion Rd
- Lot #58 S Vigue Shore Rd
- 389 Mutton Ln
- 118 Marden Shore Rd
- 436 N Pond Rd
- 45 Marden Shore Rd
Your Personal Tour Guide
Ask me questions while you tour the home.