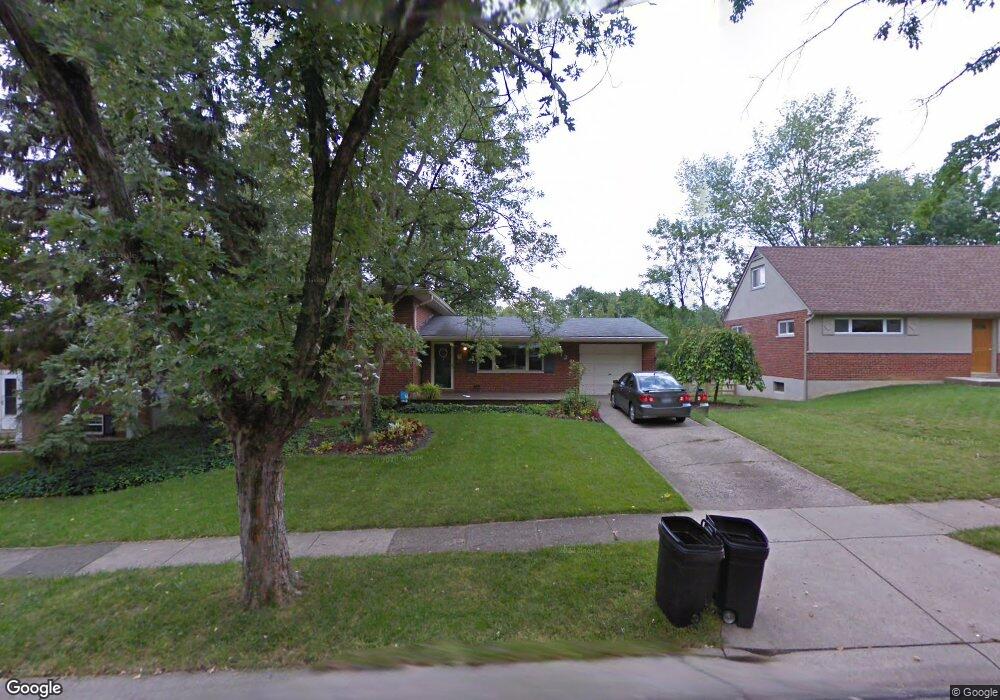
124 Julep Ln Cincinnati, OH 45218
Estimated Value: $237,000 - $276,000
4
Beds
2
Baths
1,570
Sq Ft
$166/Sq Ft
Est. Value
About This Home
This home is located at 124 Julep Ln, Cincinnati, OH 45218 and is currently estimated at $260,446, approximately $165 per square foot. 124 Julep Ln is a home located in Hamilton County with nearby schools including Calvary Academy- The.
Ownership History
Date
Name
Owned For
Owner Type
Purchase Details
Closed on
Nov 3, 1997
Sold by
Barkley Edward O and Barkley Juanita
Bought by
Macfarlane Robb T and Macfarlane Nora L
Current Estimated Value
Home Financials for this Owner
Home Financials are based on the most recent Mortgage that was taken out on this home.
Original Mortgage
$108,385
Outstanding Balance
$18,008
Interest Rate
7.42%
Mortgage Type
FHA
Estimated Equity
$242,438
Create a Home Valuation Report for This Property
The Home Valuation Report is an in-depth analysis detailing your home's value as well as a comparison with similar homes in the area
Home Values in the Area
Average Home Value in this Area
Purchase History
| Date | Buyer | Sale Price | Title Company |
|---|---|---|---|
| Macfarlane Robb T | $108,500 | -- |
Source: Public Records
Mortgage History
| Date | Status | Borrower | Loan Amount |
|---|---|---|---|
| Open | Macfarlane Robb T | $108,385 |
Source: Public Records
Tax History Compared to Growth
Tax History
| Year | Tax Paid | Tax Assessment Tax Assessment Total Assessment is a certain percentage of the fair market value that is determined by local assessors to be the total taxable value of land and additions on the property. | Land | Improvement |
|---|---|---|---|---|
| 2024 | $4,646 | $69,734 | $10,374 | $59,360 |
| 2023 | $4,334 | $69,734 | $10,374 | $59,360 |
| 2022 | $4,115 | $49,424 | $8,050 | $41,374 |
| 2021 | $4,030 | $49,424 | $8,050 | $41,374 |
| 2020 | $4,089 | $49,424 | $8,050 | $41,374 |
| 2019 | $3,975 | $42,242 | $6,881 | $35,361 |
| 2018 | $3,984 | $42,242 | $6,881 | $35,361 |
| 2017 | $3,693 | $42,242 | $6,881 | $35,361 |
| 2016 | $3,437 | $38,392 | $7,434 | $30,958 |
| 2015 | $3,229 | $38,392 | $7,434 | $30,958 |
| 2014 | $3,304 | $38,392 | $7,434 | $30,958 |
| 2013 | $3,492 | $41,731 | $8,082 | $33,649 |
Source: Public Records
Map
Nearby Homes