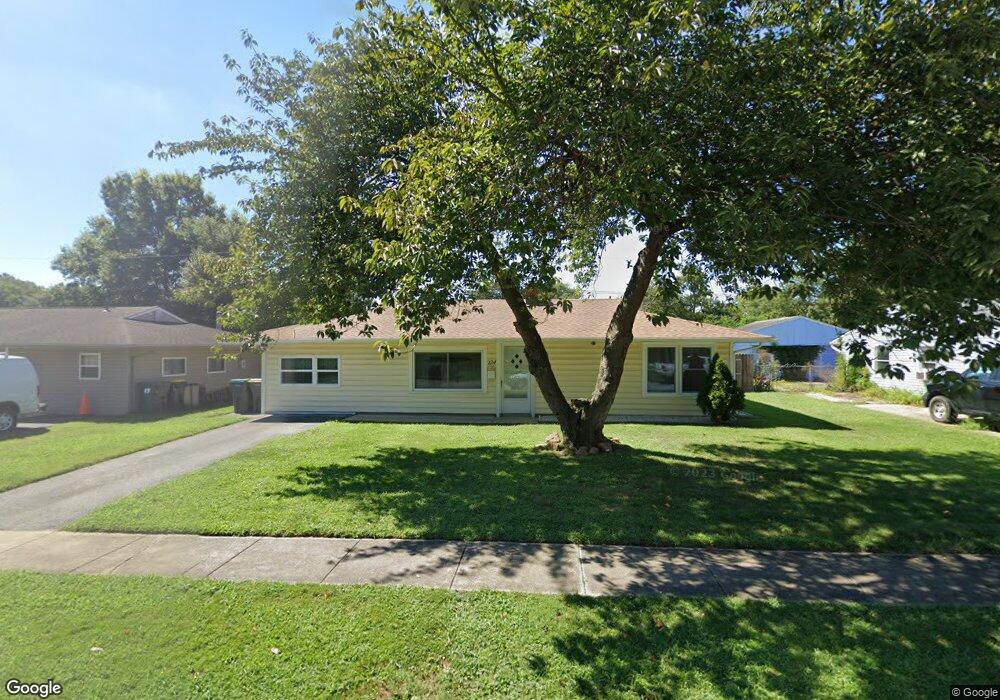
124 Kenmar Dr Newark, DE 19713
Estimated Value: $305,659 - $342,000
3
Beds
1
Bath
1,392
Sq Ft
$228/Sq Ft
Est. Value
About This Home
This home is located at 124 Kenmar Dr, Newark, DE 19713 and is currently estimated at $317,665, approximately $228 per square foot. 124 Kenmar Dr is a home located in New Castle County with nearby schools including Brookside Elementary School, Gauger-Cobbs Middle School, and Newark High School.
Ownership History
Date
Name
Owned For
Owner Type
Purchase Details
Closed on
Jan 31, 2007
Sold by
Shaikh Aamer J and Shaikh Aamer Abida
Bought by
Kukoleca Dusan and Kukoleca Gordana
Current Estimated Value
Home Financials for this Owner
Home Financials are based on the most recent Mortgage that was taken out on this home.
Original Mortgage
$110,000
Outstanding Balance
$65,885
Interest Rate
6.16%
Mortgage Type
Purchase Money Mortgage
Estimated Equity
$251,780
Purchase Details
Closed on
Oct 24, 2005
Sold by
Shaikh Aamer J
Bought by
Shaikh Aamer J and Shaikh Aamer Abida
Purchase Details
Closed on
Feb 16, 2004
Sold by
Ahmed Shaikh and Jameel Firdous
Bought by
Shaikh Aamer J
Purchase Details
Closed on
Jul 22, 2003
Sold by
Henderson Barbara
Bought by
Ahmed Shaikh and Jameel Firdous
Home Financials for this Owner
Home Financials are based on the most recent Mortgage that was taken out on this home.
Original Mortgage
$108,900
Interest Rate
5.46%
Mortgage Type
Purchase Money Mortgage
Create a Home Valuation Report for This Property
The Home Valuation Report is an in-depth analysis detailing your home's value as well as a comparison with similar homes in the area
Home Values in the Area
Average Home Value in this Area
Purchase History
| Date | Buyer | Sale Price | Title Company |
|---|---|---|---|
| Kukoleca Dusan | $170,000 | None Available | |
| Shaikh Aamer J | -- | -- | |
| Shaikh Aamer J | -- | -- | |
| Ahmed Shaikh | $60,500 | -- |
Source: Public Records
Mortgage History
| Date | Status | Borrower | Loan Amount |
|---|---|---|---|
| Open | Kukoleca Dusan | $110,000 | |
| Previous Owner | Ahmed Shaikh | $108,900 |
Source: Public Records
Tax History Compared to Growth
Tax History
| Year | Tax Paid | Tax Assessment Tax Assessment Total Assessment is a certain percentage of the fair market value that is determined by local assessors to be the total taxable value of land and additions on the property. | Land | Improvement |
|---|---|---|---|---|
| 2024 | $1,721 | $40,300 | $8,600 | $31,700 |
| 2023 | $1,673 | $40,300 | $8,600 | $31,700 |
| 2022 | $1,669 | $40,300 | $8,600 | $31,700 |
| 2021 | $1,634 | $40,300 | $8,600 | $31,700 |
| 2020 | $1,592 | $40,300 | $8,600 | $31,700 |
| 2019 | $1,548 | $40,300 | $8,600 | $31,700 |
| 2018 | $1,371 | $40,300 | $8,600 | $31,700 |
| 2017 | $1,323 | $40,300 | $8,600 | $31,700 |
| 2016 | $1,319 | $40,300 | $8,600 | $31,700 |
| 2015 | $1,202 | $40,300 | $8,600 | $31,700 |
| 2014 | $1,201 | $40,300 | $8,600 | $31,700 |
Source: Public Records
Map
Nearby Homes
- 12 S Kingston Rd
- 17 Kensington Ln
- 11 Kensington Ln
- 812 Broadfield Dr
- 71 Mercer Dr
- 22 Argyle Rd
- 209 Warfield Rd
- 5 Myers Rd
- 18 Havertown Rd
- 57 Martindale Dr
- 302 Edjil Dr
- 418 Douglas d Alley Dr
- 28 Merry Rd
- 113 Edjil Dr
- 25 Glyn Dr
- 216 Whitherspoon Ln
- 138 Felix Dr
- 29 N Skyward Dr
- 5 Fountainview Dr Unit 23
- 44 Fleming St