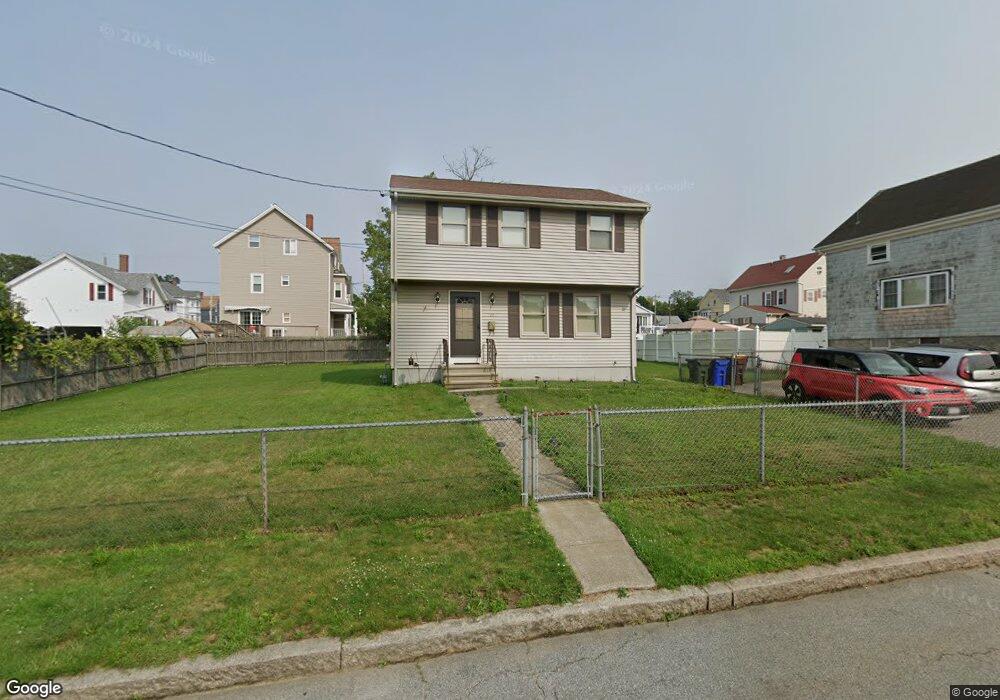
124 Lewis St Fall River, MA 02724
Sandy Beach NeighborhoodEstimated Value: $391,000 - $489,000
3
Beds
2
Baths
1,300
Sq Ft
$322/Sq Ft
Est. Value
About This Home
This home is located at 124 Lewis St, Fall River, MA 02724 and is currently estimated at $418,023, approximately $321 per square foot. 124 Lewis St is a home located in Bristol County with nearby schools including Carlton M. Viveiros Elementary School, Matthew J. Kuss Middle School, and B M C Durfee High School.
Ownership History
Date
Name
Owned For
Owner Type
Purchase Details
Closed on
Apr 12, 1994
Sold by
Fleming Eng & Bldg Co
Bought by
Arruda Richard M and Arruda Jody L
Current Estimated Value
Home Financials for this Owner
Home Financials are based on the most recent Mortgage that was taken out on this home.
Original Mortgage
$100,000
Interest Rate
7.27%
Mortgage Type
Purchase Money Mortgage
Create a Home Valuation Report for This Property
The Home Valuation Report is an in-depth analysis detailing your home's value as well as a comparison with similar homes in the area
Home Values in the Area
Average Home Value in this Area
Purchase History
| Date | Buyer | Sale Price | Title Company |
|---|---|---|---|
| Arruda Richard M | $118,000 | -- |
Source: Public Records
Mortgage History
| Date | Status | Borrower | Loan Amount |
|---|---|---|---|
| Open | Arruda Richard M | $78,000 | |
| Closed | Arruda Richard M | $100,000 |
Source: Public Records
Tax History
| Year | Tax Paid | Tax Assessment Tax Assessment Total Assessment is a certain percentage of the fair market value that is determined by local assessors to be the total taxable value of land and additions on the property. | Land | Improvement |
|---|---|---|---|---|
| 2025 | $3,552 | $310,200 | $110,100 | $200,100 |
| 2024 | $3,331 | $289,900 | $106,100 | $183,800 |
| 2023 | $3,299 | $268,900 | $87,600 | $181,300 |
| 2022 | $2,948 | $233,600 | $83,500 | $150,100 |
| 2021 | $2,885 | $208,600 | $79,400 | $129,200 |
| 2020 | $2,877 | $199,100 | $78,200 | $120,900 |
| 2019 | $2,788 | $191,200 | $75,300 | $115,900 |
| 2018 | $2,781 | $190,200 | $81,600 | $108,600 |
| 2017 | $2,582 | $184,400 | $77,800 | $106,600 |
| 2016 | $2,493 | $182,900 | $82,800 | $100,100 |
| 2015 | $2,277 | $174,100 | $82,800 | $91,300 |
| 2014 | $2,159 | $171,600 | $80,300 | $91,300 |
Source: Public Records
Map
Nearby Homes
- 20 Wilcox St
- 609 King Philip St
- 1846 S Main St
- 1852 S Main St
- 245 Dwelly St
- 234 Kilburn St
- 1334 S Main St
- 917 Dwelly St
- 57 Larouche St
- 15 Higgins St
- 1273-1279 S Main St
- 344-354 E Main St
- 219 Montaup St
- 616 Woodman St
- 240 Montaup St
- 70 Brown St
- 71 Mystic St Unit 3
- 126 Wheeler St
- 340 Vale St
- 82 Montaup St
- 138 Lewis St
- 106 Lewis St
- 115 Church St
- 115 Church St Unit 2
- 105 Church St
- 105 Church St Unit 2
- 137 Church St
- 0 Hall St
- 514 Slade St
- 522 Slade St Unit 2
- 96 Lewis St
- 96 Lewis St Unit 2
- 96 Lewis St Unit 3
- 96 Lewis St Unit 1
- 502 Slade St
- 95 Church St
- 151 Church St
- 97 Lewis St
- 86 Lewis St Unit 3
- 86 Lewis St
Your Personal Tour Guide
Ask me questions while you tour the home.