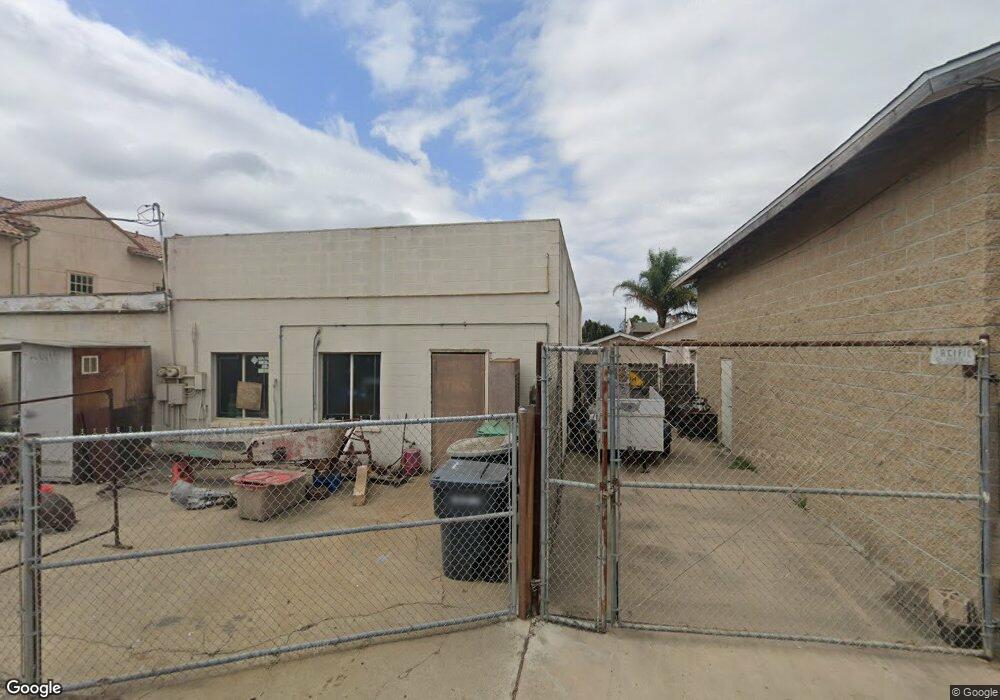
124 N F St Lompoc, CA 93436
Estimated Value: $472,652
--
Bed
1
Bath
2,000
Sq Ft
$236/Sq Ft
Est. Value
About This Home
This home is located at 124 N F St, Lompoc, CA 93436 and is currently estimated at $472,652, approximately $236 per square foot. 124 N F St is a home located in Santa Barbara County with nearby schools including Arthur Hapgood Elementary School, Lompoc Valley Middle School, and Lompoc High School.
Ownership History
Date
Name
Owned For
Owner Type
Purchase Details
Closed on
Mar 26, 2014
Sold by
Muro Charryse Marie
Bought by
Muro Ii Gildardo
Current Estimated Value
Home Financials for this Owner
Home Financials are based on the most recent Mortgage that was taken out on this home.
Original Mortgage
$242,000
Outstanding Balance
$182,798
Interest Rate
4.25%
Mortgage Type
Commercial
Estimated Equity
$289,854
Purchase Details
Closed on
Mar 20, 2014
Sold by
Sarena John G and Mcvicar Michael Lee
Bought by
Muro Ii Gildardo
Home Financials for this Owner
Home Financials are based on the most recent Mortgage that was taken out on this home.
Original Mortgage
$242,000
Outstanding Balance
$182,798
Interest Rate
4.25%
Mortgage Type
Commercial
Estimated Equity
$289,854
Purchase Details
Closed on
Apr 10, 2013
Sold by
Mcvicar Michael Lee and Mcvicar Sharon Kay
Bought by
Mcvicar Michael Lee and Mcvicar Sharon Kay
Create a Home Valuation Report for This Property
The Home Valuation Report is an in-depth analysis detailing your home's value as well as a comparison with similar homes in the area
Home Values in the Area
Average Home Value in this Area
Purchase History
| Date | Buyer | Sale Price | Title Company |
|---|---|---|---|
| Muro Ii Gildardo | -- | First American Title Company | |
| Muro Ii Gildardo | $250,000 | First American Title Company | |
| Mcvicar Michael Lee | -- | None Available | |
| Mcvicar Michael Lee | -- | None Available |
Source: Public Records
Mortgage History
| Date | Status | Borrower | Loan Amount |
|---|---|---|---|
| Open | Muro Ii Gildardo | $242,000 |
Source: Public Records
Tax History Compared to Growth
Tax History
| Year | Tax Paid | Tax Assessment Tax Assessment Total Assessment is a certain percentage of the fair market value that is determined by local assessors to be the total taxable value of land and additions on the property. | Land | Improvement |
|---|---|---|---|---|
| 2025 | $3,406 | $306,455 | $98,062 | $208,393 |
| 2023 | $3,406 | $294,556 | $94,255 | $200,301 |
| 2022 | $3,344 | $288,781 | $92,407 | $196,374 |
| 2021 | $3,378 | $283,120 | $90,596 | $192,524 |
| 2020 | $3,342 | $280,218 | $89,668 | $190,550 |
| 2019 | $3,287 | $274,724 | $87,910 | $186,814 |
| 2018 | $3,236 | $269,338 | $86,187 | $183,151 |
| 2017 | $3,176 | $264,058 | $84,498 | $179,560 |
| 2016 | $3,119 | $258,882 | $82,842 | $176,040 |
| 2014 | $3,203 | $262,621 | $75,029 | $187,592 |
Source: Public Records
Map
Nearby Homes
- 801, 851 California 246
- 122 N G St
- 220 N F St
- 224 N F St
- 315 E Chestnut Ave
- 215 S H St
- 135 N J St
- 510 N I St
- 333 S J St
- 516 N L St
- 1200 Peach Ave
- 1210 E Walnut Ave Unit D
- 615 N 1st St
- 610 E Pine Ave Unit Space 73
- 610 E Pine Ave Unit 17
- 612 University Dr
- 800 Clemens Way
- 1112 E Hickory Ave
- 214 S O St
- 1416 E Walnut Ave