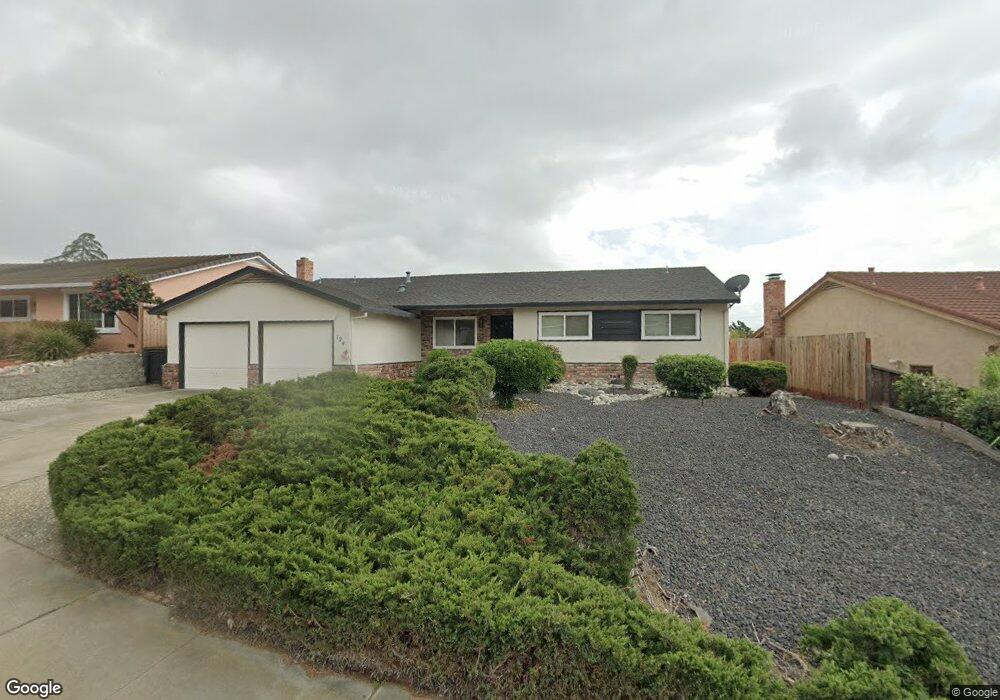
124 Nanimo Ct Antioch, CA 94509
Contra Loma NeighborhoodEstimated Value: $490,000 - $593,000
3
Beds
2
Baths
1,951
Sq Ft
$287/Sq Ft
Est. Value
About This Home
This home is located at 124 Nanimo Ct, Antioch, CA 94509 and is currently estimated at $559,313, approximately $286 per square foot. 124 Nanimo Ct is a home located in Contra Costa County with nearby schools including Sutter Elementary School, Park Middle School, and Antioch High School.
Ownership History
Date
Name
Owned For
Owner Type
Purchase Details
Closed on
Apr 16, 2009
Sold by
Dimercurio Thomas and Dimercurio Patricia A
Bought by
Dimercurio Joseph
Current Estimated Value
Home Financials for this Owner
Home Financials are based on the most recent Mortgage that was taken out on this home.
Original Mortgage
$196,377
Outstanding Balance
$123,062
Interest Rate
5.02%
Mortgage Type
FHA
Estimated Equity
$436,251
Purchase Details
Closed on
Jul 19, 1994
Sold by
Demercurio Thomas and Demercurio Patricia A
Bought by
Dimercurio Thomas and Dimercurio Patricia A
Create a Home Valuation Report for This Property
The Home Valuation Report is an in-depth analysis detailing your home's value as well as a comparison with similar homes in the area
Home Values in the Area
Average Home Value in this Area
Purchase History
We collect this data history from publicly available records. To have your information removed, we recommend requesting removal directly through your county’s website.
| Date | Buyer | Sale Price | Title Company |
|---|---|---|---|
| Dimercurio Joseph | $200,000 | North American Title Company | |
| Dimercurio Thomas | -- | -- |
Source: Public Records
Mortgage History
We collect this data history from publicly available records. To have your information removed, we recommend requesting removal directly through your county’s website.
| Date | Status | Borrower | Loan Amount |
|---|---|---|---|
| Open | Dimercurio Joseph | $196,377 |
Source: Public Records
Tax History
| Year | Tax Paid | Tax Assessment Tax Assessment Total Assessment is a certain percentage of the fair market value that is determined by local assessors to be the total taxable value of land and additions on the property. | Land | Improvement |
|---|---|---|---|---|
| 2025 | $1,567 | $95,539 | $25,698 | $69,841 |
| 2024 | $1,506 | $93,667 | $25,195 | $68,472 |
| 2023 | $1,457 | $91,831 | $24,701 | $67,130 |
| 2022 | $1,440 | $90,031 | $24,217 | $65,814 |
| 2021 | $1,382 | $88,267 | $23,743 | $64,524 |
| 2019 | $1,338 | $85,651 | $23,040 | $62,611 |
| 2018 | $1,289 | $83,973 | $22,589 | $61,384 |
| 2017 | $1,248 | $82,328 | $22,147 | $60,181 |
| 2016 | $1,200 | $80,714 | $21,713 | $59,001 |
| 2015 | $1,176 | $79,502 | $21,387 | $58,115 |
| 2014 | $1,134 | $77,946 | $20,969 | $56,977 |
Source: Public Records
Map
Nearby Homes
- 14 Terranova Dr
- 800 Gloucester St
- 3129 Milner Rd
- 3126 Lone Tree Way
- 2076 Captalpa
- 3017 Hickorynut St
- 2913 Plumleigh Ave
- 9 El Capitan Ln
- 14 El Capitan Ln
- 20 Hillside Rd
- 2803 Minta Ln
- 3600 Gallagher Cir
- 2745 El Rey St
- 3520 Dameron Place
- 4153 S Royal Links Cir
- 311 Huntington Dr
- 1119 San Jose Dr
- 4006 Boulder Dr
- 2406 D St
- 3112 Garrow Dr
Your Personal Tour Guide
Ask me questions while you tour the home.