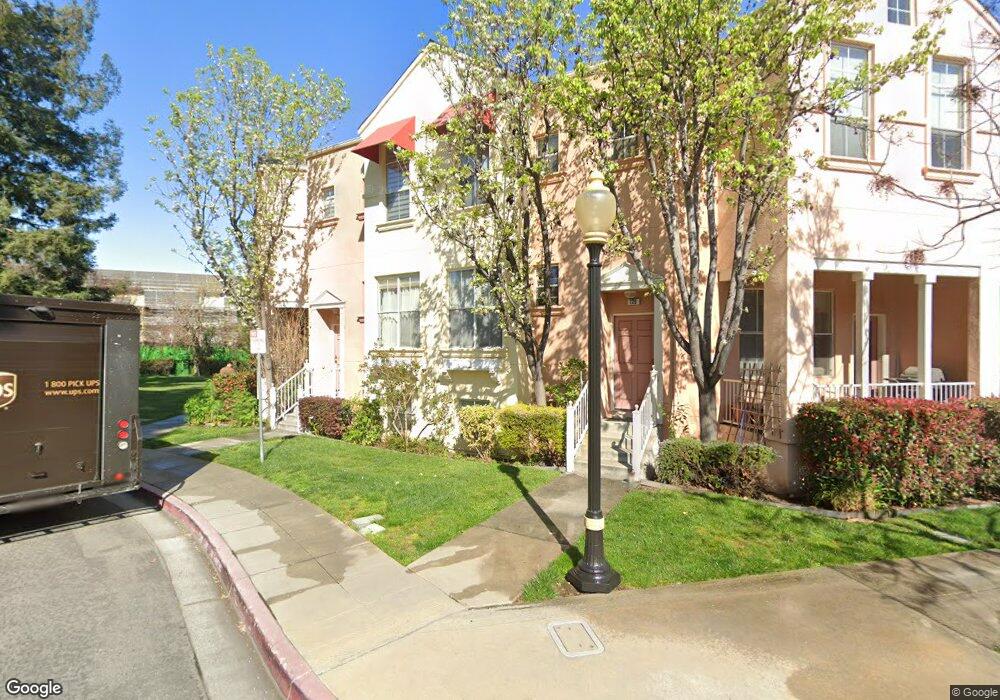
124 Pacchetti Way Mountain View, CA 94040
Mountain View West NeighborhoodEstimated Value: $1,126,000 - $1,348,000
3
Beds
3
Baths
1,292
Sq Ft
$933/Sq Ft
Est. Value
About This Home
This home is located at 124 Pacchetti Way, Mountain View, CA 94040 and is currently estimated at $1,205,441, approximately $933 per square foot. 124 Pacchetti Way is a home located in Santa Clara County with nearby schools including Covington Elementary School, Ardis G. Egan Junior High School, and Los Altos High School.
Ownership History
Date
Name
Owned For
Owner Type
Purchase Details
Closed on
Mar 21, 2006
Sold by
Brewer Stephan C and Sarandi Lynette
Bought by
Sarandi Lynette
Current Estimated Value
Home Financials for this Owner
Home Financials are based on the most recent Mortgage that was taken out on this home.
Original Mortgage
$417,000
Outstanding Balance
$235,449
Interest Rate
6.25%
Mortgage Type
New Conventional
Estimated Equity
$969,992
Purchase Details
Closed on
Nov 2, 1998
Sold by
Plymouth Mountain View Centre Lp
Bought by
Brewer Stephan C and Brewer Lynette S
Home Financials for this Owner
Home Financials are based on the most recent Mortgage that was taken out on this home.
Original Mortgage
$271,950
Interest Rate
6.42%
Create a Home Valuation Report for This Property
The Home Valuation Report is an in-depth analysis detailing your home's value as well as a comparison with similar homes in the area
Home Values in the Area
Average Home Value in this Area
Purchase History
| Date | Buyer | Sale Price | Title Company |
|---|---|---|---|
| Sarandi Lynette | -- | Ticor Title Company Of Ca | |
| Brewer Stephan C | $340,000 | Fidelity National Title Co |
Source: Public Records
Mortgage History
| Date | Status | Borrower | Loan Amount |
|---|---|---|---|
| Open | Sarandi Lynette | $417,000 | |
| Closed | Brewer Stephan C | $271,950 | |
| Closed | Brewer Stephan C | $33,950 |
Source: Public Records
Tax History
| Year | Tax Paid | Tax Assessment Tax Assessment Total Assessment is a certain percentage of the fair market value that is determined by local assessors to be the total taxable value of land and additions on the property. | Land | Improvement |
|---|---|---|---|---|
| 2025 | $6,816 | $532,608 | $313,534 | $219,074 |
| 2024 | $6,816 | $522,166 | $307,387 | $214,779 |
| 2023 | $6,675 | $511,928 | $301,360 | $210,568 |
| 2022 | $6,626 | $501,891 | $295,451 | $206,440 |
| 2021 | $6,656 | $492,051 | $289,658 | $202,393 |
| 2020 | $6,703 | $487,006 | $286,688 | $200,318 |
| 2019 | $6,409 | $477,458 | $281,067 | $196,391 |
| 2018 | $6,356 | $468,097 | $275,556 | $192,541 |
| 2017 | $6,137 | $458,919 | $270,153 | $188,766 |
| 2016 | $5,973 | $449,921 | $264,856 | $185,065 |
| 2015 | $5,892 | $443,164 | $260,878 | $182,286 |
| 2014 | $5,833 | $434,484 | $255,768 | $178,716 |
Source: Public Records
Map
Nearby Homes
- 126 Pacchetti Way
- 131 Concord Cir
- 49 Showers Dr Unit A130
- 49 Showers Dr Unit N265
- 2483 Whitney Dr
- 164 Montelena Ct
- 2235 Mora Place
- 2272 Towne Cir
- 2375 Adele Ave
- 400 Ortega Ave Unit 216
- 400 Ortega Ave Unit 313
- 400 Ortega Ave Unit 301
- 70 Towne Cir
- 444 San Antonio Rd Unit 1A
- 444 San Antonio Rd Unit 7A
- 4107 Mackay Dr
- 426 Hillwood Ct Unit 303
- 280 College Ave
- 3003 Marcelli Cir
- 4388 El Camino Real Unit 130
- 128 Pacchetti Way
- 122 Pacchetti Way
- 130 Pacchetti Way
- 120 Pacchetti Way
- 118 Pacchetti Way
- 116 Pacchetti Way
- 109 Showers Ct
- 114 Pacchetti Way
- 107 Showers Ct
- 112 Pacchetti Way
- 110 Pacchetti Way
- 105 Showers Ct
- 108 Pacchetti Way
- 103 Showers Ct
- 106 Pacchetti Way
- 142 Pacchetti Way
- 138 Pacchetti Way
- 140 Pacchetti Way
- 144 Pacchetti Way
- 104 Pacchetti Way
Your Personal Tour Guide
Ask me questions while you tour the home.