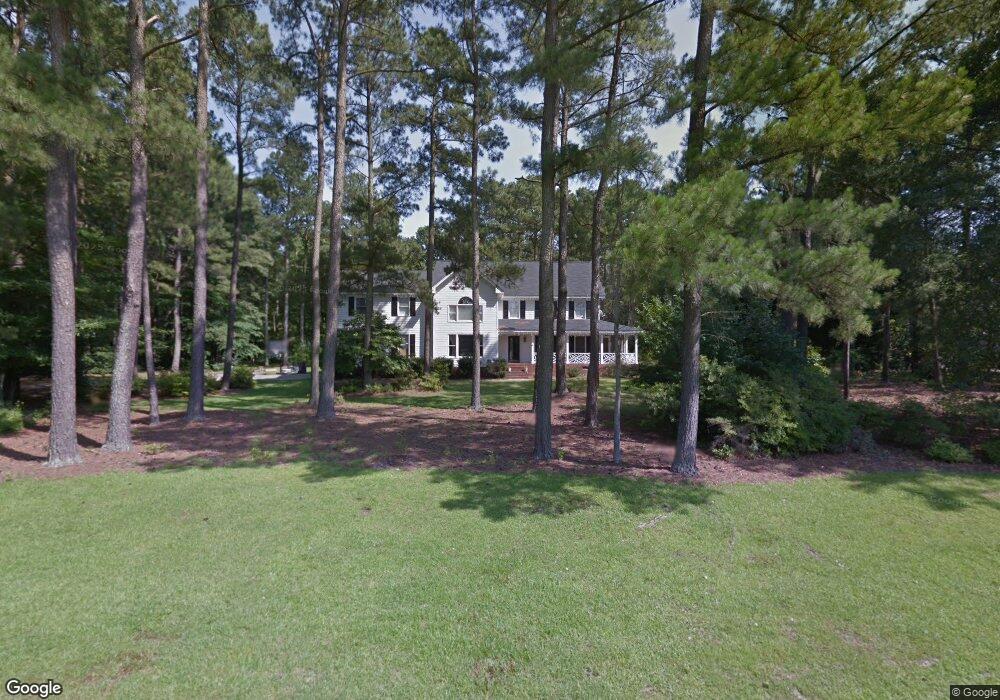
124 Quail Run Smithfield, NC 27577
Estimated Value: $566,000 - $698,000
4
Beds
3
Baths
4,139
Sq Ft
$150/Sq Ft
Est. Value
About This Home
This home is located at 124 Quail Run, Smithfield, NC 27577 and is currently estimated at $621,991, approximately $150 per square foot. 124 Quail Run is a home located in Johnston County with nearby schools including West Smithfield Elementary School, Smithfield Middle School, and Smithfield-Selma High School.
Ownership History
Date
Name
Owned For
Owner Type
Purchase Details
Closed on
Feb 4, 2015
Sold by
Branch Banking & Trust Company
Bought by
Kane Michael S and Kane Shauna H
Current Estimated Value
Home Financials for this Owner
Home Financials are based on the most recent Mortgage that was taken out on this home.
Original Mortgage
$237,869
Outstanding Balance
$182,525
Interest Rate
3.81%
Mortgage Type
New Conventional
Estimated Equity
$439,466
Purchase Details
Closed on
Sep 9, 2011
Sold by
Lee William Dale and Lee Sarah W
Bought by
Colville Ricky
Home Financials for this Owner
Home Financials are based on the most recent Mortgage that was taken out on this home.
Original Mortgage
$339,900
Interest Rate
4.38%
Mortgage Type
New Conventional
Purchase Details
Closed on
Mar 22, 2002
Sold by
Lee William Dale
Bought by
Dickens Robert Carl
Create a Home Valuation Report for This Property
The Home Valuation Report is an in-depth analysis detailing your home's value as well as a comparison with similar homes in the area
Home Values in the Area
Average Home Value in this Area
Purchase History
| Date | Buyer | Sale Price | Title Company |
|---|---|---|---|
| Kane Michael S | $240,000 | None Available | |
| Colville Ricky | $339,500 | None Available | |
| Dickens Robert Carl | $315,000 | -- |
Source: Public Records
Mortgage History
| Date | Status | Borrower | Loan Amount |
|---|---|---|---|
| Open | Kane Michael S | $237,869 | |
| Previous Owner | Colville Ricky | $339,900 |
Source: Public Records
Tax History
| Year | Tax Paid | Tax Assessment Tax Assessment Total Assessment is a certain percentage of the fair market value that is determined by local assessors to be the total taxable value of land and additions on the property. | Land | Improvement |
|---|---|---|---|---|
| 2025 | $3,605 | $564,220 | $100,000 | $464,220 |
| 2024 | $2,880 | $351,340 | $90,000 | $261,340 |
| 2023 | $2,903 | $351,340 | $90,000 | $261,340 |
| 2022 | $3,046 | $351,340 | $90,000 | $261,340 |
| 2021 | $2,986 | $351,340 | $90,000 | $261,340 |
| 2020 | $3,098 | $351,340 | $90,000 | $261,340 |
| 2019 | $3,098 | $351,340 | $90,000 | $261,340 |
| 2018 | $3,157 | $350,770 | $90,000 | $260,770 |
| 2017 | $3,157 | $350,770 | $90,000 | $260,770 |
| 2016 | $3,096 | $343,990 | $90,000 | $253,990 |
| 2015 | $3,062 | $343,990 | $90,000 | $253,990 |
| 2014 | $3,062 | $343,990 | $90,000 | $253,990 |
Source: Public Records
Map
Nearby Homes
- 0 N Brightleaf & Galilee Blvd Unit 10136028
- 1100 S Lakeside Dr
- 0 Country Club Rd
- Poplar Plan at The View at Holt Lake
- Retreat Plan at The View at Holt Lake
- Prelude Plan at The View at Holt Lake
- Wayfare Plan at The View at Holt Lake
- Escape Plan at The View at Holt Lake
- 120 Muscovy Dr
- 110 Muscovy Dr
- 70 Muscovy Dr
- 131 Muscovy Dr
- 141 Muscovy Dr
- 90 Muscovy Dr
- 150 Muscovy Dr
- 130 Muscovy Dr
- 140 Muscovy Dr
- 4516 U S 301
- 4516 Us 301 Hwy
- 2310 Devils Racetrack Rd
- 120 Quail Run
- 125 Quail Run
- 128 Quail Run
- 129 Quail Run
- 116 Quail Run
- 121 Quail Run
- 132 Quail Run
- 117 Quail Run
- 133 Quail Run
- 112 Quail Run
- 277 Tyler Dr
- 113 Quail Run
- 3402 U S Highway 301 S
- 3402 Us Highway 301 S
- 3420 Us Highway 301 S
- 136 Quail Run
- 3388 Us Highway 301 S
- 109 Quail Run
- 3440 Us Highway 301 S
- 108 Quail Run
Your Personal Tour Guide
Ask me questions while you tour the home.