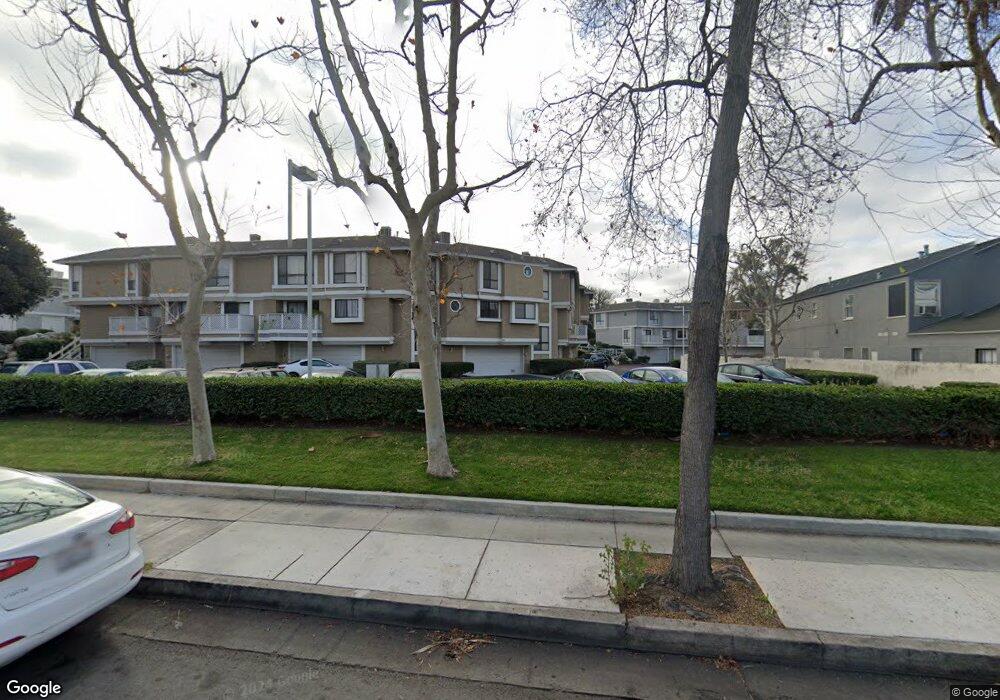
124 S Seneca Cir Anaheim, CA 92805
The Colony NeighborhoodEstimated Value: $622,528 - $667,000
2
Beds
1
Bath
1,191
Sq Ft
$539/Sq Ft
Est. Value
About This Home
This home is located at 124 S Seneca Cir, Anaheim, CA 92805 and is currently estimated at $641,632, approximately $538 per square foot. 124 S Seneca Cir is a home located in Orange County with nearby schools including Benjamin Franklin Elementary School, Sycamore Junior High School, and Anaheim High School.
Ownership History
Date
Name
Owned For
Owner Type
Purchase Details
Closed on
Mar 11, 2022
Sold by
Ann Moses Deborah
Bought by
Milad Ehab E and Makram Georgette F
Current Estimated Value
Home Financials for this Owner
Home Financials are based on the most recent Mortgage that was taken out on this home.
Original Mortgage
$472,500
Outstanding Balance
$441,118
Interest Rate
3.85%
Mortgage Type
New Conventional
Estimated Equity
$200,514
Purchase Details
Closed on
Apr 5, 2019
Sold by
Moses Deborah A
Bought by
Moses Deborah Ann and Rupert Demetrius Eugene
Home Financials for this Owner
Home Financials are based on the most recent Mortgage that was taken out on this home.
Original Mortgage
$280,000
Interest Rate
4.3%
Mortgage Type
New Conventional
Purchase Details
Closed on
May 2, 1997
Sold by
Roberson Steven M and Roberson Laura A
Bought by
Moses Deborah A
Home Financials for this Owner
Home Financials are based on the most recent Mortgage that was taken out on this home.
Original Mortgage
$97,275
Interest Rate
8.14%
Mortgage Type
FHA
Create a Home Valuation Report for This Property
The Home Valuation Report is an in-depth analysis detailing your home's value as well as a comparison with similar homes in the area
Home Values in the Area
Average Home Value in this Area
Purchase History
| Date | Buyer | Sale Price | Title Company |
|---|---|---|---|
| Milad Ehab E | $576,000 | New Title Company Name | |
| Moses Deborah Ann | -- | Stewart Title Company | |
| Moses Deborah A | $100,000 | Fidelity National Title Ins |
Source: Public Records
Mortgage History
| Date | Status | Borrower | Loan Amount |
|---|---|---|---|
| Open | Milad Ehab E | $472,500 | |
| Previous Owner | Moses Deborah Ann | $280,000 | |
| Previous Owner | Moses Deborah A | $97,275 |
Source: Public Records
Tax History
| Year | Tax Paid | Tax Assessment Tax Assessment Total Assessment is a certain percentage of the fair market value that is determined by local assessors to be the total taxable value of land and additions on the property. | Land | Improvement |
|---|---|---|---|---|
| 2025 | $6,895 | $611,255 | $491,648 | $119,607 |
| 2024 | $6,895 | $599,270 | $482,008 | $117,262 |
| 2023 | $6,751 | $587,520 | $472,557 | $114,963 |
| 2022 | $1,984 | $153,463 | $17,585 | $135,878 |
| 2021 | $1,983 | $150,454 | $17,240 | $133,214 |
| 2020 | $1,972 | $148,912 | $17,063 | $131,849 |
| 2019 | $1,919 | $145,993 | $16,729 | $129,264 |
| 2018 | $1,880 | $143,131 | $16,401 | $126,730 |
| 2017 | $1,811 | $140,325 | $16,079 | $124,246 |
| 2016 | $1,802 | $137,574 | $15,764 | $121,810 |
| 2015 | $1,784 | $135,508 | $15,527 | $119,981 |
| 2014 | $1,682 | $132,854 | $15,223 | $117,631 |
Source: Public Records
Map
Nearby Homes
- 148 S Seneca Cir Unit 24
- 282 S Seneca Cir Unit 49
- 102 S Seneca Cir Unit 2
- 211 N Resh St
- 314 S Ohio St
- 116 S Harbor Blvd Unit 102
- 435 W Center Street Promenade Unit 323
- 523 S Citron St
- 1122 W Broadway
- 1126 W Broadway
- 326 S Clementine St
- 615 S Helena St
- 431 S Anaheim Blvd Unit 5
- 405 S Anaheim Blvd Unit 5
- 615 S Hazelwood St
- 716 N Harbor Blvd
- 278 N Wilshire Ave Unit B21
- 743 N Janss St
- 318 N Claudina St
- 701 W Provential Dr
- 124 S Seneca Cir Unit 12
- 122 S Seneca Cir Unit 11
- 120 S Seneca Cir Unit 10
- 126 S Seneca Cir Unit 13
- 138 S Seneca Cir
- 136 S Seneca Cir
- 128 S Seneca Cir Unit 14
- 134 S Seneca Cir Unit 17
- 118 S Seneca Cir Unit 9
- 140 S Seneca Cir Unit 20
- 140 S Seneca Cir
- 132 S Seneca Cir Unit 16
- 130 S Seneca Cir Unit 15
- 142 S Seneca Cir Unit 21
- 142 S Seneca Cir
- 116 S Seneca Cir
- 144 S Seneca Cir Unit 22
- 154 S Seneca Cir Unit 27
- 156 S Seneca Cir Unit 28
- 112 S Citron St
Your Personal Tour Guide
Ask me questions while you tour the home.