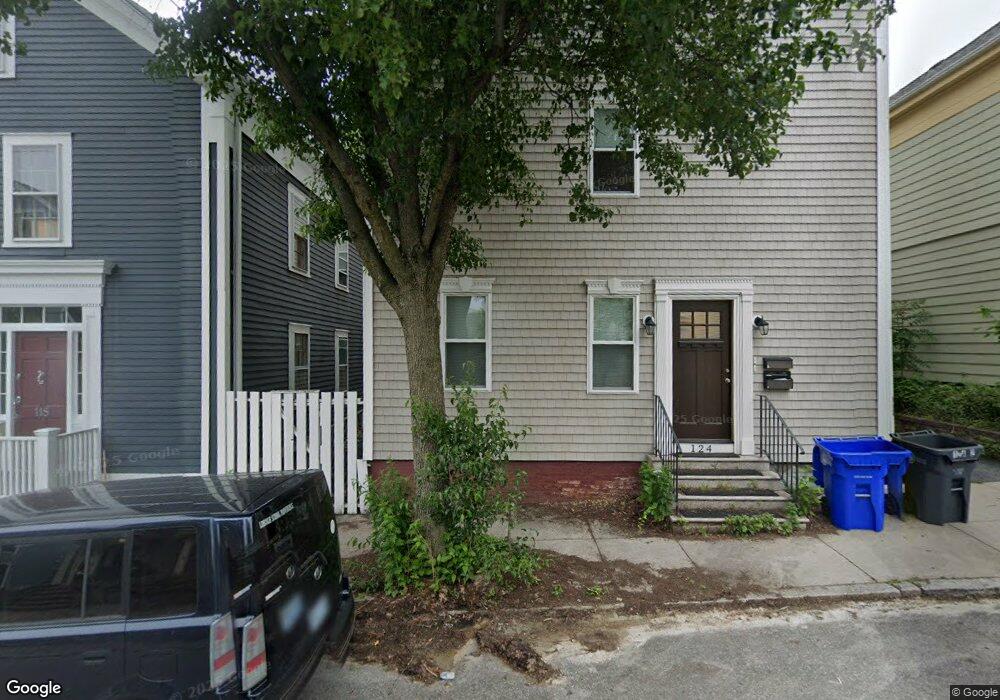
124 Sheldon St Unit 2 Providence, RI 02906
Fox Point NeighborhoodEstimated Value: $1,076,000 - $1,363,000
5
Beds
4
Baths
1,850
Sq Ft
$642/Sq Ft
Est. Value
About This Home
This home is located at 124 Sheldon St Unit 2, Providence, RI 02906 and is currently estimated at $1,187,789, approximately $642 per square foot. 124 Sheldon St Unit 2 is a home located in Providence County with nearby schools including Asa Messer Elementary School, Charles N. Fortes Elementary School, and Robert L. Bailey IV Elementary.
Ownership History
Date
Name
Owned For
Owner Type
Purchase Details
Closed on
Jan 2, 2025
Sold by
Hope 59 Llc
Bought by
Rehmtulla Masooma and Shaikh Amir
Current Estimated Value
Home Financials for this Owner
Home Financials are based on the most recent Mortgage that was taken out on this home.
Original Mortgage
$832,500
Outstanding Balance
$825,274
Interest Rate
6.84%
Mortgage Type
Purchase Money Mortgage
Estimated Equity
$362,515
Purchase Details
Closed on
May 31, 2016
Sold by
Janczynski Darlene M
Bought by
Nyer Kal
Home Financials for this Owner
Home Financials are based on the most recent Mortgage that was taken out on this home.
Original Mortgage
$288,800
Interest Rate
3.58%
Mortgage Type
New Conventional
Purchase Details
Closed on
Jan 21, 2015
Sold by
Silva Mary E Est and Curran
Bought by
Silva Mary E
Create a Home Valuation Report for This Property
The Home Valuation Report is an in-depth analysis detailing your home's value as well as a comparison with similar homes in the area
Home Values in the Area
Average Home Value in this Area
Purchase History
| Date | Buyer | Sale Price | Title Company |
|---|---|---|---|
| Rehmtulla Masooma | $1,110,000 | None Available | |
| Rehmtulla Masooma | $1,110,000 | None Available | |
| Rehmtulla Masooma | $1,110,000 | None Available | |
| Rehmtulla Masooma | $1,110,000 | None Available | |
| Nyer Kal | $361,000 | -- | |
| Nyer Kal | $361,000 | -- | |
| Silva Mary E | $225,000 | -- | |
| Silva Mary E | $225,000 | -- |
Source: Public Records
Mortgage History
| Date | Status | Borrower | Loan Amount |
|---|---|---|---|
| Open | Rehmtulla Masooma | $832,500 | |
| Closed | Rehmtulla Masooma | $832,500 | |
| Previous Owner | Nyer Kal | $288,800 |
Source: Public Records
Tax History Compared to Growth
Tax History
| Year | Tax Paid | Tax Assessment Tax Assessment Total Assessment is a certain percentage of the fair market value that is determined by local assessors to be the total taxable value of land and additions on the property. | Land | Improvement |
|---|---|---|---|---|
| 2025 | $13,110 | $936,400 | $432,600 | $503,800 |
| 2024 | $12,742 | $694,400 | $330,400 | $364,000 |
| 2023 | $12,742 | $694,400 | $330,400 | $364,000 |
| 2022 | $12,360 | $694,400 | $330,400 | $364,000 |
| 2021 | $11,035 | $449,300 | $209,600 | $239,700 |
| 2020 | $11,035 | $449,300 | $209,600 | $239,700 |
| 2019 | $11,035 | $449,300 | $209,600 | $239,700 |
| 2018 | $10,601 | $331,700 | $193,300 | $138,400 |
| 2017 | $10,601 | $331,700 | $193,300 | $138,400 |
| 2016 | $10,601 | $331,700 | $193,300 | $138,400 |
| 2015 | $8,748 | $264,300 | $193,300 | $71,000 |
| 2014 | $8,920 | $264,300 | $193,300 | $71,000 |
| 2013 | $8,920 | $264,300 | $193,300 | $71,000 |
Source: Public Records
Map
Nearby Homes
- 427 Wickenden St
- 323 Wickenden St
- 104 Sheldon St
- 273 Wickenden St
- 207 Williams St Unit 2
- 84 Transit St
- 73 Trenton St
- 670 Wickenden St
- 96 Gano St Unit 3
- 555 S Water St Unit 325
- 117 Benevolent St
- 130 Gano St
- 130 Gano St Unit A
- 20 E George St
- 63 Pitman St Unit 5
- 63 Pitman St Unit 4
- 165 Waterman St Unit 2
- 124 Pitman St
- 55 Second St
- 81 Burgess Ave
- 128 Sheldon St
- 118 Sheldon St
- 201 Transit St
- 195 Transit St
- 112 Sheldon St
- 123 Sheldon St
- 127 Sheldon St
- 129 Sheldon St Unit 1L
- 191 Transit St
- 117 Sheldon St
- 72 Hope St
- 115 Sheldon St
- 70 Hope St
- 70 Hope St Unit 2
- 113 Sheldon St
- 133 Sheldon St
- 104 Sheldon St Unit 2
- 104 Sheldon St Unit 1
- 66 Hope St
- 185 Transit St