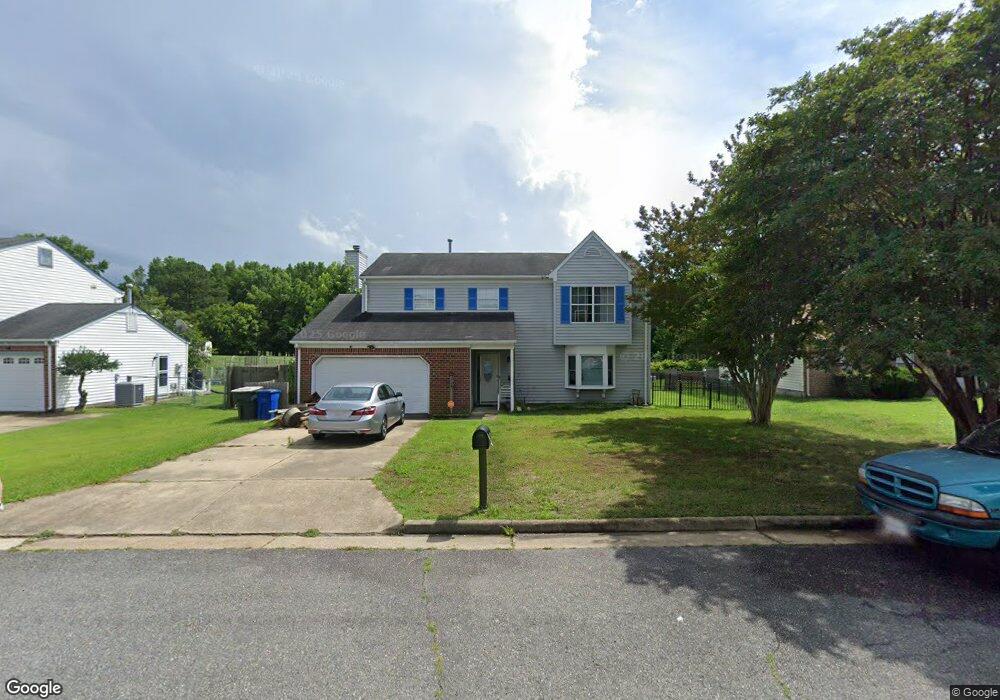
124 Strawberry Ln Newport News, VA 23602
Nelson NeighborhoodEstimated Value: $348,000 - $367,000
4
Beds
3
Baths
1,940
Sq Ft
$184/Sq Ft
Est. Value
About This Home
This home is located at 124 Strawberry Ln, Newport News, VA 23602 and is currently estimated at $356,812, approximately $183 per square foot. 124 Strawberry Ln is a home located in Newport News City with nearby schools including Knollwood Meadows Elementary School, Mary Passage Middle School, and Denbigh High School.
Ownership History
Date
Name
Owned For
Owner Type
Purchase Details
Closed on
May 17, 2024
Sold by
Brosious Jeffrey and Brosious Mikayla Paige
Bought by
Yenta Holdings Llc
Current Estimated Value
Home Financials for this Owner
Home Financials are based on the most recent Mortgage that was taken out on this home.
Original Mortgage
$311,471
Outstanding Balance
$307,008
Interest Rate
7.1%
Mortgage Type
Seller Take Back
Estimated Equity
$49,804
Purchase Details
Closed on
Apr 22, 2014
Sold by
Reynolds Leola
Bought by
Guerrero Luciano
Home Financials for this Owner
Home Financials are based on the most recent Mortgage that was taken out on this home.
Original Mortgage
$212,472
Interest Rate
4.32%
Mortgage Type
VA
Purchase Details
Closed on
Sep 24, 1999
Sold by
Hale Lonnie L
Bought by
Reynolds Leola
Home Financials for this Owner
Home Financials are based on the most recent Mortgage that was taken out on this home.
Original Mortgage
$113,810
Interest Rate
7.85%
Create a Home Valuation Report for This Property
The Home Valuation Report is an in-depth analysis detailing your home's value as well as a comparison with similar homes in the area
Home Values in the Area
Average Home Value in this Area
Purchase History
| Date | Buyer | Sale Price | Title Company |
|---|---|---|---|
| Yenta Holdings Llc | $311,471 | Old Republic National Title In | |
| Guerrero Luciano | $208,000 | -- | |
| Reynolds Leola | $119,800 | -- |
Source: Public Records
Mortgage History
| Date | Status | Borrower | Loan Amount |
|---|---|---|---|
| Open | Yenta Holdings Llc | $311,471 | |
| Previous Owner | Guerrero Luciano | $212,472 | |
| Previous Owner | Reynolds Leola | $113,810 |
Source: Public Records
Tax History Compared to Growth
Tax History
| Year | Tax Paid | Tax Assessment Tax Assessment Total Assessment is a certain percentage of the fair market value that is determined by local assessors to be the total taxable value of land and additions on the property. | Land | Improvement |
|---|---|---|---|---|
| 2025 | $4,081 | $341,300 | $73,900 | $267,400 |
| 2024 | $3,934 | $333,400 | $66,000 | $267,400 |
| 2023 | $3,931 | $320,700 | $66,000 | $254,700 |
| 2022 | $3,497 | $279,200 | $66,000 | $213,200 |
| 2021 | $3,138 | $245,200 | $60,000 | $185,200 |
| 2020 | $2,757 | $213,900 | $60,000 | $153,900 |
| 2019 | $2,730 | $213,900 | $60,000 | $153,900 |
| 2018 | $2,660 | $206,600 | $60,000 | $146,600 |
| 2017 | $2,574 | $199,600 | $60,000 | $139,600 |
| 2016 | $2,570 | $199,600 | $60,000 | $139,600 |
| 2015 | $2,564 | $199,600 | $60,000 | $139,600 |
| 2014 | $2,281 | $199,600 | $60,000 | $139,600 |
Source: Public Records
Map
Nearby Homes
- 19 Evelyn Dr
- 51 Deer Run Trail
- 117 Virginia Dr
- 32 Jolama Dr
- 783 Childress Dr
- 803 Ashley Place
- 207 Ford Ct
- 131 Denbigh Blvd
- 214 Denbigh Blvd
- 832 Garrow Rd
- 140 Gingerwood Ct
- 702 Lipton Dr
- 623 Haystack Landing Rd
- 840 Garrow Rd
- 865 Wilmont Ln
- 517 Quarterfield Rd
- 862 Moyer Rd
- 892 Garrow Rd
- 419 Lanyard Rd
- 863 Catalina Dr
- 126 Strawberry Ln
- 122 Strawberry Ln
- 120 Strawberry Ln
- 128 Strawberry Ln
- 102 Larson Ct
- 118 Strawberry Ln
- 121 Strawberry Ln
- 77 Garrow Rd
- 130 Strawberry Ln
- 81 Garrow Rd
- 129 Strawberry Ln
- 104 Larson Ct
- 103 Larson Ct
- 116 Strawberry Ln
- 117 Strawberry Ln
- 59 Garrow Rd
- 83 Garrow Rd
- 106 Larson Ct
- 105 Larson Ct
- 57 Garrow Rd