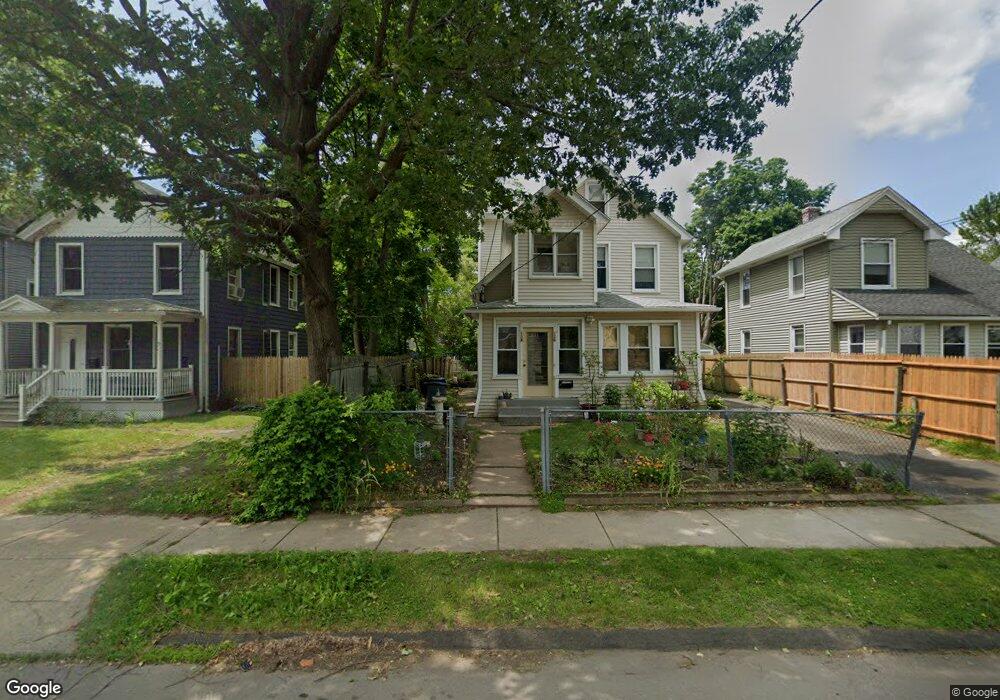
124 Union Ave West Haven, CT 06516
West Haven Center NeighborhoodEstimated Value: $414,000 - $508,000
5
Beds
3
Baths
2,540
Sq Ft
$181/Sq Ft
Est. Value
About This Home
This home is located at 124 Union Ave, West Haven, CT 06516 and is currently estimated at $459,866, approximately $181 per square foot. 124 Union Ave is a home located in New Haven County with nearby schools including Carrigan 5/6 Intermediate School, Harry M. Bailey Middle School, and West Haven High School.
Ownership History
Date
Name
Owned For
Owner Type
Purchase Details
Closed on
Jun 16, 2005
Sold by
Fresher Craig K
Bought by
Patil Dipti L and Nath Suchita R
Current Estimated Value
Purchase Details
Closed on
Aug 28, 2001
Sold by
Lynn Louis R and Lynn Sylvia K
Bought by
Freshner Craig K
Create a Home Valuation Report for This Property
The Home Valuation Report is an in-depth analysis detailing your home's value as well as a comparison with similar homes in the area
Home Values in the Area
Average Home Value in this Area
Purchase History
| Date | Buyer | Sale Price | Title Company |
|---|---|---|---|
| Patil Dipti L | $268,500 | -- | |
| Patil Dipti L | $268,500 | -- | |
| Freshner Craig K | $81,275 | -- | |
| Freshner Craig K | $81,275 | -- |
Source: Public Records
Mortgage History
| Date | Status | Borrower | Loan Amount |
|---|---|---|---|
| Open | Freshner Craig K | $178,500 | |
| Closed | Freshner Craig K | $25,000 | |
| Closed | Freshner Craig K | $195,000 |
Source: Public Records
Tax History Compared to Growth
Tax History
| Year | Tax Paid | Tax Assessment Tax Assessment Total Assessment is a certain percentage of the fair market value that is determined by local assessors to be the total taxable value of land and additions on the property. | Land | Improvement |
|---|---|---|---|---|
| 2025 | $9,787 | $283,430 | $61,390 | $222,040 |
| 2024 | $9,333 | $192,360 | $42,490 | $149,870 |
| 2023 | $8,947 | $192,360 | $42,490 | $149,870 |
| 2022 | $8,772 | $192,360 | $42,490 | $149,870 |
| 2021 | $8,772 | $192,360 | $42,490 | $149,870 |
| 2020 | $7,387 | $146,370 | $34,370 | $112,000 |
| 2019 | $7,124 | $146,370 | $34,370 | $112,000 |
| 2018 | $7,062 | $146,370 | $34,370 | $112,000 |
| 2017 | $6,683 | $146,370 | $34,370 | $112,000 |
| 2016 | $6,669 | $146,370 | $34,370 | $112,000 |
| 2015 | $6,217 | $154,070 | $37,730 | $116,340 |
| 2014 | $6,178 | $154,070 | $37,730 | $116,340 |
Source: Public Records
Map
Nearby Homes