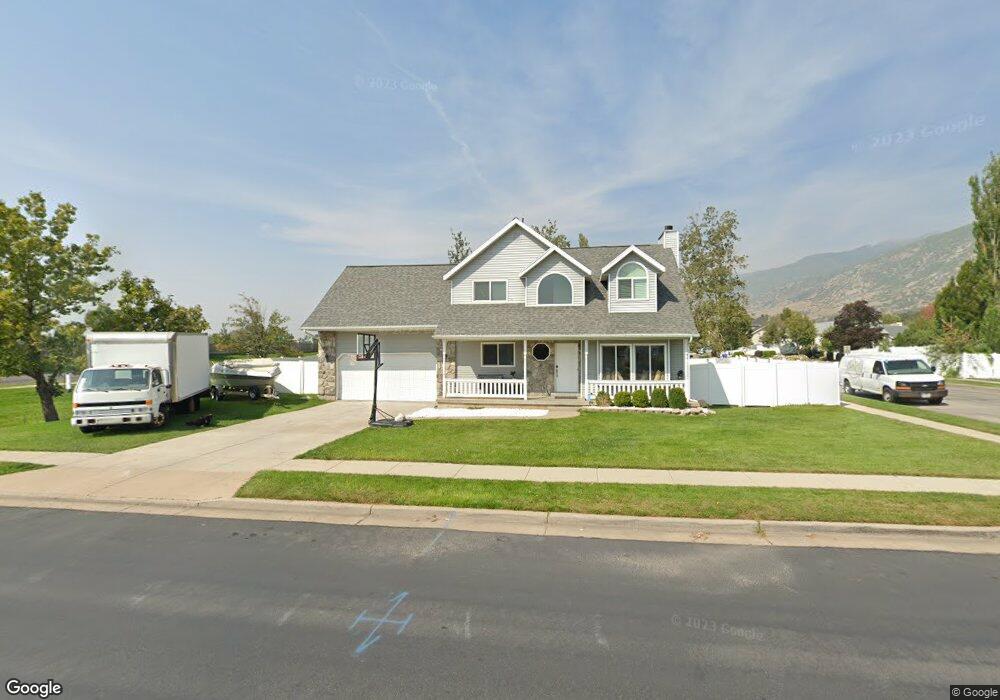
124 W 1340 S Farmington, UT 84025
Estimated Value: $553,795 - $605,000
5
Beds
3
Baths
2,097
Sq Ft
$274/Sq Ft
Est. Value
About This Home
This home is located at 124 W 1340 S, Farmington, UT 84025 and is currently estimated at $573,699, approximately $273 per square foot. 124 W 1340 S is a home located in Davis County with nearby schools including Reading School, Centerville Jr High, and Viewmont High School.
Ownership History
Date
Name
Owned For
Owner Type
Purchase Details
Closed on
May 25, 2017
Sold by
Murphy John and Murphy Kristen
Bought by
Cordoba Miguel Angel
Current Estimated Value
Purchase Details
Closed on
Oct 14, 2005
Sold by
Dorius Wade H and Dorius Larry
Bought by
Rolfson Shay and Rolfson Megan
Home Financials for this Owner
Home Financials are based on the most recent Mortgage that was taken out on this home.
Original Mortgage
$39,950
Interest Rate
5.25%
Mortgage Type
Stand Alone Second
Purchase Details
Closed on
Jan 4, 2002
Sold by
Morani Steven J
Bought by
Dorius Wade H and Dorius Larry
Purchase Details
Closed on
Jul 21, 1999
Sold by
Haskell Brian D and Haskell Karen R
Bought by
Morani Steven J
Home Financials for this Owner
Home Financials are based on the most recent Mortgage that was taken out on this home.
Original Mortgage
$124,000
Interest Rate
7.51%
Create a Home Valuation Report for This Property
The Home Valuation Report is an in-depth analysis detailing your home's value as well as a comparison with similar homes in the area
Home Values in the Area
Average Home Value in this Area
Purchase History
| Date | Buyer | Sale Price | Title Company |
|---|---|---|---|
| Cordoba Miguel Angel | -- | None Available | |
| Rolfson Shay | -- | Equity Title Ins Agency Inc | |
| Dorius Wade H | -- | Security Title Company | |
| Morani Steven J | -- | Security Title Company |
Source: Public Records
Mortgage History
| Date | Status | Borrower | Loan Amount |
|---|---|---|---|
| Previous Owner | Rolfson Shay | $39,950 | |
| Previous Owner | Rolfson Shay | $159,800 | |
| Previous Owner | Morani Steven J | $124,000 |
Source: Public Records
Tax History Compared to Growth
Tax History
| Year | Tax Paid | Tax Assessment Tax Assessment Total Assessment is a certain percentage of the fair market value that is determined by local assessors to be the total taxable value of land and additions on the property. | Land | Improvement |
|---|---|---|---|---|
| 2025 | $2,734 | $270,051 | $136,681 | $133,370 |
| 2024 | $2,646 | $264,550 | $133,424 | $131,126 |
| 2023 | $2,519 | $459,000 | $203,168 | $255,832 |
| 2022 | $2,541 | $262,900 | $100,714 | $162,186 |
| 2021 | $2,305 | $355,000 | $159,381 | $195,619 |
| 2020 | $2,084 | $313,000 | $136,776 | $176,224 |
| 2019 | $2,128 | $310,000 | $138,307 | $171,693 |
| 2018 | $1,951 | $280,000 | $133,615 | $146,385 |
| 2016 | $1,840 | $135,960 | $63,639 | $72,321 |
| 2015 | $1,753 | $122,925 | $63,639 | $59,286 |
| 2014 | $1,652 | $119,061 | $63,639 | $55,422 |
| 2013 | -- | $114,292 | $32,720 | $81,572 |
Source: Public Records
Map
Nearby Homes