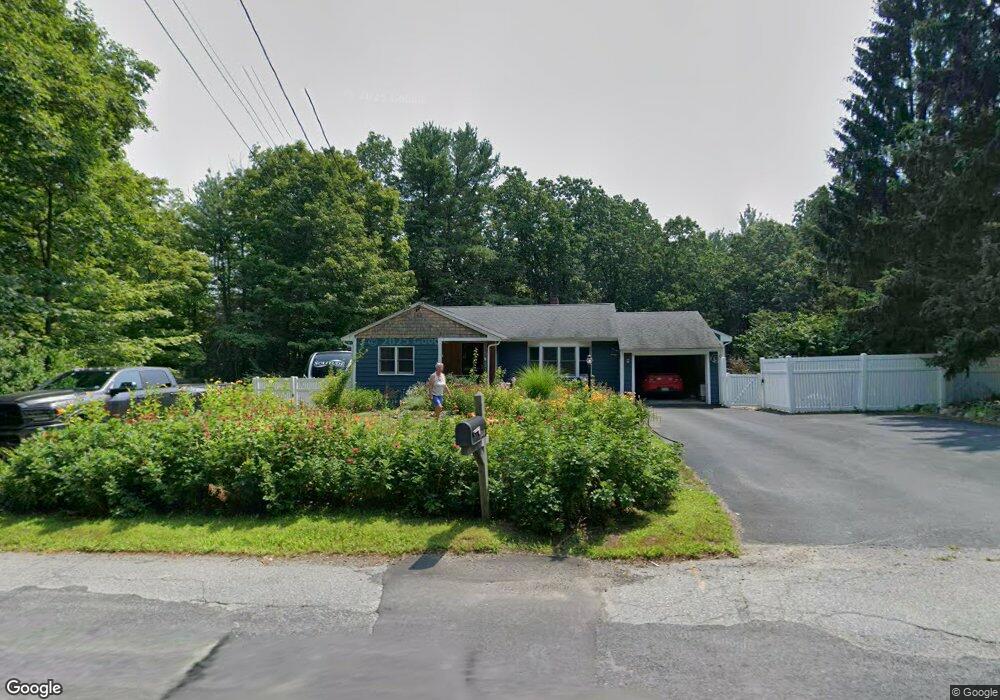
124 Whitcomb Ave Littleton, MA 01460
Estimated Value: $665,719 - $756,000
3
Beds
3
Baths
1,616
Sq Ft
$433/Sq Ft
Est. Value
About This Home
This home is located at 124 Whitcomb Ave, Littleton, MA 01460 and is currently estimated at $699,680, approximately $432 per square foot. 124 Whitcomb Ave is a home located in Middlesex County with nearby schools including Shaker Lane Elementary School, Russell Street Elementary School, and Littleton Middle School.
Ownership History
Date
Name
Owned For
Owner Type
Purchase Details
Closed on
Feb 25, 2003
Sold by
Picard Jeremy J and Olson Kristen M
Bought by
Divoll Martha and Mccown Robert
Current Estimated Value
Home Financials for this Owner
Home Financials are based on the most recent Mortgage that was taken out on this home.
Original Mortgage
$248,000
Interest Rate
5.98%
Mortgage Type
Purchase Money Mortgage
Purchase Details
Closed on
Dec 15, 2000
Sold by
Thornton T Michael and Thornton Lynn M
Bought by
Olson Kristen M and Picard Jeremy J
Home Financials for this Owner
Home Financials are based on the most recent Mortgage that was taken out on this home.
Original Mortgage
$196,000
Interest Rate
7.7%
Mortgage Type
Purchase Money Mortgage
Purchase Details
Closed on
Jul 31, 1996
Sold by
Vanbaalen Marcus and Vanbaalen Louissa
Bought by
Thornton T Michael and King Lynn M
Create a Home Valuation Report for This Property
The Home Valuation Report is an in-depth analysis detailing your home's value as well as a comparison with similar homes in the area
Home Values in the Area
Average Home Value in this Area
Purchase History
| Date | Buyer | Sale Price | Title Company |
|---|---|---|---|
| Divoll Martha | $310,000 | -- | |
| Olson Kristen M | $245,000 | -- | |
| Thornton T Michael | $178,000 | -- |
Source: Public Records
Mortgage History
| Date | Status | Borrower | Loan Amount |
|---|---|---|---|
| Open | Thornton T Michael | $178,000 | |
| Closed | Divoll Martha | $248,000 | |
| Previous Owner | Thornton T Michael | $196,000 | |
| Previous Owner | Thornton T Michael | $150,000 |
Source: Public Records
Tax History Compared to Growth
Tax History
| Year | Tax Paid | Tax Assessment Tax Assessment Total Assessment is a certain percentage of the fair market value that is determined by local assessors to be the total taxable value of land and additions on the property. | Land | Improvement |
|---|---|---|---|---|
| 2025 | $8,112 | $545,900 | $232,700 | $313,200 |
| 2024 | $7,600 | $512,100 | $226,100 | $286,000 |
| 2023 | $7,530 | $463,400 | $230,500 | $232,900 |
| 2022 | $7,580 | $428,000 | $230,500 | $197,500 |
| 2021 | $10,035 | $412,000 | $221,800 | $190,200 |
| 2020 | $6,872 | $386,700 | $206,500 | $180,200 |
| 2019 | $6,435 | $352,800 | $179,900 | $172,900 |
| 2018 | $6,169 | $340,100 | $177,700 | $162,400 |
| 2017 | $6,058 | $333,800 | $177,700 | $156,100 |
| 2016 | $5,880 | $332,400 | $177,700 | $154,700 |
| 2015 | $5,698 | $314,800 | $153,800 | $161,000 |
Source: Public Records
Map
Nearby Homes
- 150 Whitcomb Ave
- 3 Taylor St
- 332 Old Littleton Rd
- 17 Chestnut Ln
- 221 Foster St
- 18 Pleasant St
- Lot 2 Strawberry Farm
- 0 Ayer Rd
- 63 Leonard Rd Unit 63
- 17 Hartwell Ave
- 9 (Lt 44) Darrell Dr
- 239 Ayer Rd Unit 16
- 239 Ayer Rd Unit 46
- 4 Spectacle Pond Rd
- 78 Shaker Rd
- 62 Waite Rd
- 36 Whitetail Way
- 89 School House Ln
- 146 Tahattawan Rd
- 336 King St Unit 105
- 128 Whitcomb Ave
- 120 Whitcomb Ave
- 125 Whitcomb Ave
- 123 Whitcomb Ave
- 130 Whitcomb Ave
- 15 Porter Rd
- 116 Whitcomb Ave
- 19 Porter Rd
- 12 Porter Rd
- 2 Old Orchard Ln
- 8 Porter Rd
- 16 Porter Rd
- 133 Whitcomb Ave
- 121 Whitcomb Ave
- 134 Whitcomb Ave
- 20 Porter Rd
- 4 Old Orchard Ln
- 1 Old Orchard Ln
- 23 Porter Rd
- 110 Whitcomb Ave