Estimated Value: $170,819 - $188,000
3
Beds
2
Baths
1,168
Sq Ft
$154/Sq Ft
Est. Value
About This Home
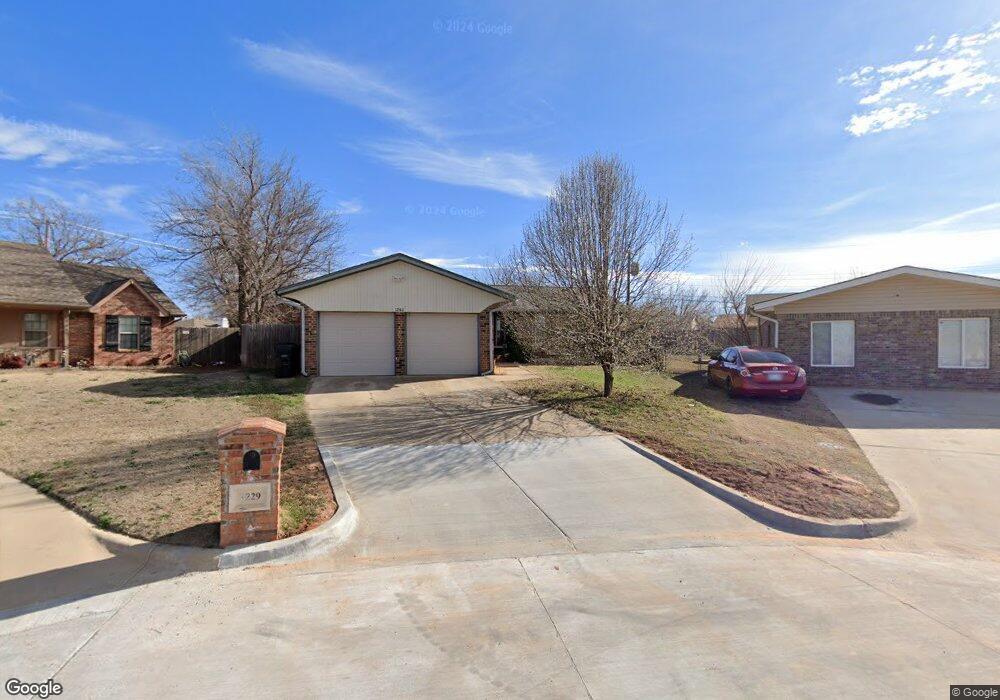
This home is located at 1240 Janeway Cir, Moore, OK 73160 and is currently estimated at $180,455, approximately $154 per square foot. 1240 Janeway Cir is a home located in Cleveland County with nearby schools including Plaza Towers Elementary School, Highland West Junior High School, and Southmoore High School.
Ownership History
Date
Name
Owned For
Owner Type
Purchase Details
Closed on
Oct 24, 2025
Sold by
Palmer Sierra and Nadeau Sierra Lynn
Bought by
Palmer Edward
Current Estimated Value
Purchase Details
Closed on
Jun 22, 2011
Sold by
Gallant Ryan D and Gallant Tammy
Bought by
Palmer Edward and Palmer Sierra
Home Financials for this Owner
Home Financials are based on the most recent Mortgage that was taken out on this home.
Original Mortgage
$99,289
Interest Rate
4.55%
Mortgage Type
VA
Purchase Details
Closed on
Jul 21, 2008
Sold by
Mcalister Joseph F and Mcalister Patricia Y
Bought by
Gallant Ryan D and Gallant Tammy
Home Financials for this Owner
Home Financials are based on the most recent Mortgage that was taken out on this home.
Original Mortgage
$98,574
Interest Rate
6.36%
Mortgage Type
VA
Purchase Details
Closed on
Sep 21, 2004
Sold by
Smith Steven W and Smith Trina K
Bought by
Mcalister Joseph F and Mcalister Patricia Y
Create a Home Valuation Report for This Property
The Home Valuation Report is an in-depth analysis detailing your home's value as well as a comparison with similar homes in the area
Home Values in the Area
Average Home Value in this Area
Purchase History
| Date | Buyer | Sale Price | Title Company |
|---|---|---|---|
| Palmer Edward | -- | None Listed On Document | |
| Palmer Edward | $97,500 | The Oklahoma City Abstract & | |
| Gallant Ryan D | $96,500 | The Oklahoma City Abstract & | |
| Mcalister Joseph F | $71,000 | -- |
Source: Public Records
Mortgage History
| Date | Status | Borrower | Loan Amount |
|---|---|---|---|
| Previous Owner | Palmer Edward | $99,289 | |
| Previous Owner | Gallant Ryan D | $98,574 |
Source: Public Records
Tax History
| Year | Tax Paid | Tax Assessment Tax Assessment Total Assessment is a certain percentage of the fair market value that is determined by local assessors to be the total taxable value of land and additions on the property. | Land | Improvement |
|---|---|---|---|---|
| 2025 | $1,662 | $13,578 | $2,809 | $10,769 |
| 2024 | $1,557 | $12,827 | $2,544 | $10,283 |
| 2023 | $1,489 | $12,216 | $2,386 | $9,830 |
| 2022 | $1,439 | $11,635 | $2,222 | $9,413 |
| 2021 | $1,377 | $11,081 | $2,040 | $9,041 |
| 2020 | $1,378 | $11,081 | $2,040 | $9,041 |
| 2019 | $1,403 | $11,081 | $2,040 | $9,041 |
| 2018 | $1,404 | $11,081 | $2,040 | $9,041 |
| 2017 | $1,411 | $11,081 | $0 | $0 |
| 2016 | $1,421 | $11,081 | $2,040 | $9,041 |
| 2015 | $1,258 | $10,840 | $1,114 | $9,726 |
| 2014 | $674 | $5,672 | $1,020 | $4,652 |
Source: Public Records
Map
Nearby Homes
- 690 SW 12th St
- 779 SW 14th St
- 621 SW 7th St
- 849 SW 10th St
- 1205 S Howard Ave
- 913 S Howard Ave
- 133 SW 14th St
- 132 SW 16th St
- 753 SW 4th Place
- 764 SW 3rd St
- 925 SW 14th St
- 117 SW 6th St
- 924 SW 15th St
- 712 Penn Ln
- 209 S Irving Dr
- 947 SW 4th Place
- 1025 SW 16th St
- 936 SW 2nd St
- 705 W Main St
- 13908 Broadway Ave
- 1229 Janeway Cir
- 1244 Janeway Cir
- 1225 Janeway Cir
- 1305 Heather Ln
- 1225 Janeway Cir
- 1250 Janeway Cir
- 716 Little River Cir
- 1211 Heather Ln
- 1301 Heather Ln
- 712 Little River Cir
- 1309 Heather Ln
- 708 Little River Cir
- 1216 S Janeway Ave
- 1304 S Janeway Ave
- 1216 Janeway Cir
- 1207 Heather Ln
- 1317 Heather Ln
- 704 Little River Cir
- 700 Little River Cir
- 1401 Heather Ln
Your Personal Tour Guide
Ask me questions while you tour the home.