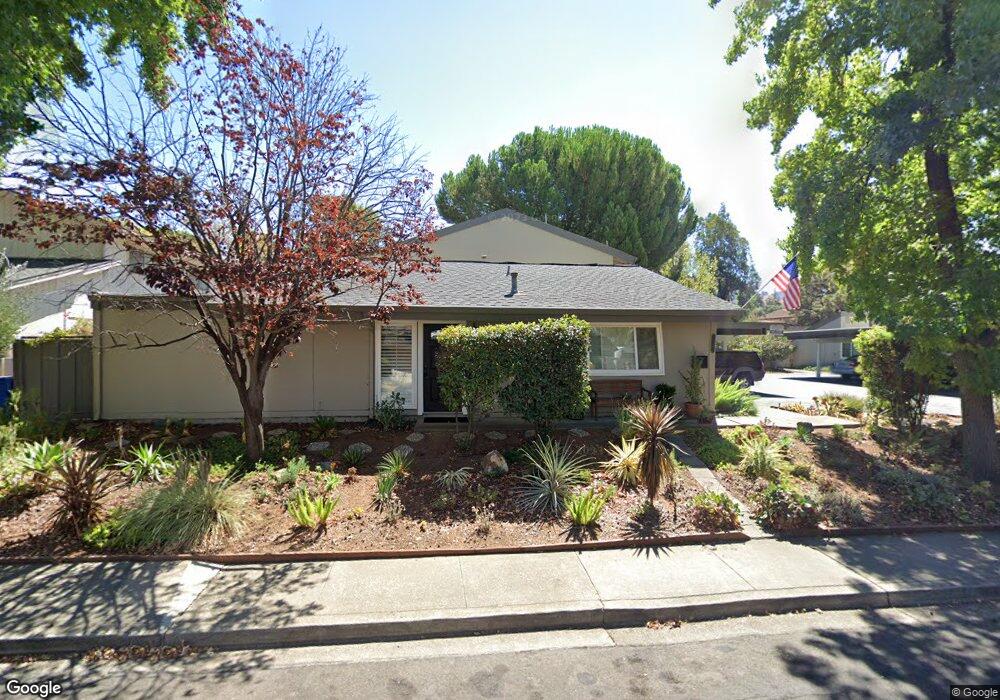
1240 Kenwal Rd Unit C Concord, CA 94521
Midtown Concord NeighborhoodEstimated Value: $410,249 - $511,000
2
Beds
2
Baths
1,016
Sq Ft
$438/Sq Ft
Est. Value
About This Home
This home is located at 1240 Kenwal Rd Unit C, Concord, CA 94521 and is currently estimated at $444,562, approximately $437 per square foot. 1240 Kenwal Rd Unit C is a home located in Contra Costa County with nearby schools including Silverwood Elementary School, Pine Hollow Middle School, and College Park High School.
Ownership History
Date
Name
Owned For
Owner Type
Purchase Details
Closed on
Dec 14, 2020
Sold by
Papas Julie A
Bought by
Rasiewicz Carly Rae
Current Estimated Value
Home Financials for this Owner
Home Financials are based on the most recent Mortgage that was taken out on this home.
Original Mortgage
$370,500
Outstanding Balance
$329,856
Interest Rate
2.7%
Mortgage Type
New Conventional
Estimated Equity
$114,707
Purchase Details
Closed on
Nov 4, 1999
Sold by
Williams Joyce A Tre
Bought by
Papas Julie A
Home Financials for this Owner
Home Financials are based on the most recent Mortgage that was taken out on this home.
Original Mortgage
$99,750
Interest Rate
7.68%
Mortgage Type
Purchase Money Mortgage
Purchase Details
Closed on
Oct 13, 1998
Sold by
Joyce Papas and Joyce A
Bought by
Williams Joyce A
Create a Home Valuation Report for This Property
The Home Valuation Report is an in-depth analysis detailing your home's value as well as a comparison with similar homes in the area
Home Values in the Area
Average Home Value in this Area
Purchase History
| Date | Buyer | Sale Price | Title Company |
|---|---|---|---|
| Rasiewicz Carly Rae | $390,000 | Placer Title Company | |
| Papas Julie A | $105,000 | North American Title Co | |
| Williams Joyce A | -- | -- |
Source: Public Records
Mortgage History
| Date | Status | Borrower | Loan Amount |
|---|---|---|---|
| Open | Rasiewicz Carly Rae | $370,500 | |
| Previous Owner | Papas Julie A | $99,750 |
Source: Public Records
Tax History
| Year | Tax Paid | Tax Assessment Tax Assessment Total Assessment is a certain percentage of the fair market value that is determined by local assessors to be the total taxable value of land and additions on the property. | Land | Improvement |
|---|---|---|---|---|
| 2025 | $5,580 | $422,145 | $282,513 | $139,632 |
| 2024 | $5,316 | $413,869 | $276,974 | $136,895 |
| 2023 | $5,316 | $405,755 | $271,544 | $134,211 |
| 2022 | $5,231 | $397,800 | $266,220 | $131,580 |
| 2021 | $5,171 | $390,000 | $261,000 | $129,000 |
| 2019 | $1,441 | $65,417 | $19,282 | $46,135 |
| 2018 | $1,370 | $64,135 | $18,904 | $45,231 |
| 2017 | $1,304 | $62,879 | $18,534 | $44,345 |
| 2016 | $1,248 | $61,647 | $18,171 | $43,476 |
| 2015 | $1,257 | $60,722 | $17,899 | $42,823 |
| 2014 | $1,199 | $59,534 | $17,549 | $41,985 |
Source: Public Records
Map
Nearby Homes
- 1175 Kenwal Rd Unit B
- 1395 Kenwal Rd Unit A
- 1195 Kenwal Rd Unit B
- 5451 Roundtree Place
- 1120 Kenwal Rd Unit C
- 5434 Roundtree Ct Unit A
- 5442 Roundtree Ct Unit A
- 5333 Park Highlands Blvd Unit 27
- 5497 Roundtree Dr Unit D
- 5468 Roundtree Dr Unit C
- 5492 Roundtree Dr Unit A
- 5506 Nebraska Dr
- 1297 Kansas Cir
- 1271 Kentucky Dr
- 1520 Schenone Ct Unit 15
- 5520 Alaska Dr
- 5150 Brookside Ln
- 1531 Garcez Dr
- 1505 Kirker Pass Rd Unit 170
- 1505 Kirker Pass Rd Unit 164
- 1240 Kenwal Rd
- 1240 Kenwal Rd Unit D
- 1240 Kenwal Rd Unit B
- 1240 Kenwal Rd Unit A
- 1260 Kenwal Rd
- 1260 Kenwal Rd Unit 1
- 1295 Kenwal Rd Unit D
- 1295 Kenwal Rd Unit C
- 1295 Kenwal Rd Unit B
- 1295 Kenwal Rd Unit A
- 1290 Kenwal Rd Unit 3
- 1290 Kenwal Rd
- 1290 Kenwal Rd Unit 2
- 1290 Kenwal Rd Unit 1
- 1275 Kenwal Rd Unit D
- 1275 Kenwal Rd Unit C
- 1275 Kenwal Rd Unit B
- 1275 Kenwal Rd Unit A
- 1200 Kenwal Rd
- 1200 Kenwal Rd Unit D
Your Personal Tour Guide
Ask me questions while you tour the home.