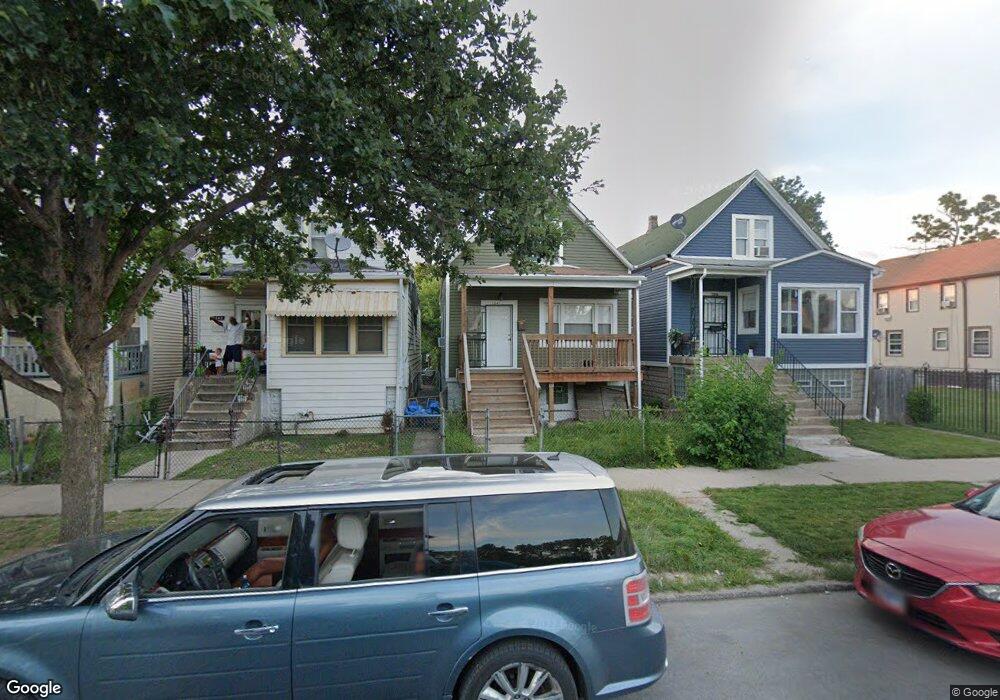
1240 W 74th Place Chicago, IL 60636
Englewood NeighborhoodEstimated Value: $101,000 - $169,000
2
Beds
1
Bath
840
Sq Ft
$150/Sq Ft
Est. Value
About This Home
This home is located at 1240 W 74th Place, Chicago, IL 60636 and is currently estimated at $125,857, approximately $149 per square foot. 1240 W 74th Place is a home located in Cook County with nearby schools including Stagg Elementary School, Bogan Computer Technical High School, and St Sabina Academy.
Ownership History
Date
Name
Owned For
Owner Type
Purchase Details
Closed on
Sep 29, 2025
Sold by
Pennymac Loan Services Llc
Bought by
Garcia Fredy Alcauter
Current Estimated Value
Purchase Details
Closed on
Mar 19, 2025
Sold by
Intercounty Judicial Sales Corporation
Bought by
Pennymac Loan Services Llc
Purchase Details
Closed on
Jul 23, 2019
Sold by
Fathers Brothers And Sons Of Chicago Inc
Bought by
Tyson Michael
Home Financials for this Owner
Home Financials are based on the most recent Mortgage that was taken out on this home.
Original Mortgage
$124,699
Interest Rate
3.87%
Mortgage Type
FHA
Purchase Details
Closed on
Feb 16, 2019
Sold by
Brown Leanthony
Bought by
Fathers Brothers And Sons Of Chicago Inc
Home Financials for this Owner
Home Financials are based on the most recent Mortgage that was taken out on this home.
Original Mortgage
$57,850
Interest Rate
4.4%
Mortgage Type
Unknown
Purchase Details
Closed on
Oct 19, 2009
Sold by
Us Bank National Association
Bought by
Brown Laanthony
Purchase Details
Closed on
Mar 9, 2009
Sold by
Leach
Bought by
Us Bank National Association
Purchase Details
Closed on
Dec 15, 2005
Sold by
Hopkins Daryl and Smith Warren
Bought by
Leach Rodney
Home Financials for this Owner
Home Financials are based on the most recent Mortgage that was taken out on this home.
Original Mortgage
$133,000
Interest Rate
6.48%
Mortgage Type
Fannie Mae Freddie Mac
Purchase Details
Closed on
Jan 9, 2005
Sold by
Thomas Latasha M
Bought by
Hopkins Daryl and Smith Warren
Home Financials for this Owner
Home Financials are based on the most recent Mortgage that was taken out on this home.
Original Mortgage
$108,000
Interest Rate
7.93%
Mortgage Type
Unknown
Purchase Details
Closed on
Jun 18, 2001
Sold by
Franklin Credit Management Corp
Bought by
Thomas Latasha M
Home Financials for this Owner
Home Financials are based on the most recent Mortgage that was taken out on this home.
Original Mortgage
$35,890
Interest Rate
7.2%
Purchase Details
Closed on
Mar 27, 2001
Sold by
Brown
Bought by
Franklin Credit Management Corp
Purchase Details
Closed on
Apr 7, 2000
Sold by
Jack Anderson Inc
Bought by
Brown Bennie
Home Financials for this Owner
Home Financials are based on the most recent Mortgage that was taken out on this home.
Original Mortgage
$66,300
Interest Rate
8.18%
Purchase Details
Closed on
Dec 13, 1999
Sold by
Norwest Bank Minnesota
Bought by
Jack Anderson Inc
Create a Home Valuation Report for This Property
The Home Valuation Report is an in-depth analysis detailing your home's value as well as a comparison with similar homes in the area
Home Values in the Area
Average Home Value in this Area
Purchase History
| Date | Buyer | Sale Price | Title Company |
|---|---|---|---|
| Garcia Fredy Alcauter | $65,500 | First American Title Insurance | |
| Pennymac Loan Services Llc | -- | None Listed On Document | |
| Tyson Michael | $127,000 | Citywide Title Corporation | |
| Fathers Brothers And Sons Of Chicago Inc | -- | Greater Illinois Title Co | |
| Brown Laanthony | $10,000 | First American Title | |
| Us Bank National Association | -- | None Available | |
| Leach Rodney | $140,000 | Law Title | |
| Hopkins Daryl | $120,000 | Law Title | |
| Thomas Latasha M | $37,000 | -- | |
| Franklin Credit Management Corp | -- | -- | |
| Brown Bennie | $78,000 | Intercounty Title | |
| Jack Anderson Inc | $35,000 | Intercounty Title |
Source: Public Records
Mortgage History
| Date | Status | Borrower | Loan Amount |
|---|---|---|---|
| Previous Owner | Tyson Michael | $124,699 | |
| Previous Owner | Fathers Brothers And Sons Of Chicago Inc | $57,850 | |
| Previous Owner | Leach Rodney | $133,000 | |
| Previous Owner | Hopkins Daryl | $108,000 | |
| Previous Owner | Thomas Latasha M | $35,890 | |
| Previous Owner | Brown Bennie | $66,300 | |
| Closed | Brown Bennie | $7,800 |
Source: Public Records
Tax History Compared to Growth
Tax History
| Year | Tax Paid | Tax Assessment Tax Assessment Total Assessment is a certain percentage of the fair market value that is determined by local assessors to be the total taxable value of land and additions on the property. | Land | Improvement |
|---|---|---|---|---|
| 2024 | $1,793 | $13,001 | $938 | $12,063 |
| 2023 | $1,748 | $8,500 | $2,031 | $6,469 |
| 2022 | $1,748 | $8,500 | $2,031 | $6,469 |
| 2021 | $1,709 | $8,499 | $2,031 | $6,468 |
| 2020 | $1,138 | $5,107 | $2,343 | $2,764 |
| 2019 | $1,140 | $5,675 | $2,343 | $3,332 |
| 2018 | $1,121 | $5,675 | $2,343 | $3,332 |
| 2017 | $1,278 | $5,935 | $2,031 | $3,904 |
| 2016 | $1,189 | $5,935 | $2,031 | $3,904 |
| 2015 | $1,088 | $5,935 | $2,031 | $3,904 |
| 2014 | $953 | $5,138 | $1,875 | $3,263 |
| 2013 | $934 | $5,138 | $1,875 | $3,263 |
Source: Public Records
Map
Nearby Homes
- 1244 W 74th Place
- 7300 S Racine Ave
- 1241 W 72nd Place
- 7342 S Aberdeen St
- 7520 S May St
- 1445 W 73rd St
- 7318 S Aberdeen St
- 7238 S May St
- 7520 S Aberdeen St
- 7545 S May St
- 7232 S Aberdeen St
- 7535 S Aberdeen St
- 7634 S May St
- 7144 S May St
- 7220 S Carpenter St
- 7611 S Aberdeen St
- 7700 S Ada St
- 7529 S Carpenter St
- 7411 S Morgan St
- 7151 S Aberdeen St
- 1238 W 74th Place
- 1242 W 74th Place
- 1246 W 74th Place
- 1248 W 74th Place
- 1228 W 74th Place
- 1250 W 74th Place
- 1226 W 74th Place
- 1256 W 74th Place
- 1233 W 74th St
- 1233 W 74th Place Unit 1
- 1251 W 74th St
- 1231 W 74th St
- 1222 W 74th Place
- 1258 W 74th Place
- 1229 W 74th St
- 1253 W 74th St
- 1260 W 74th Place
- 1235 W 74th Place
- 1225 W 74th St
- 1255 W 74th St