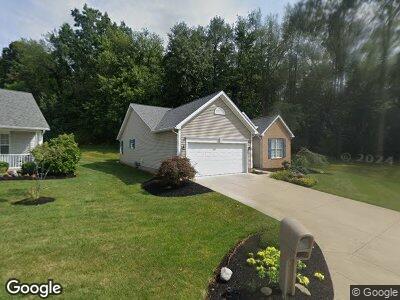
1240 White Stone Cir NE Canton, OH 44721
Estimated Value: $312,729 - $383,000
2
Beds
2
Baths
1,744
Sq Ft
$198/Sq Ft
Est. Value
About This Home
This home is located at 1240 White Stone Cir NE, Canton, OH 44721 and is currently estimated at $346,182, approximately $198 per square foot. 1240 White Stone Cir NE is a home located in Stark County with nearby schools including Middlebranch Elementary School, Oakwood Middle School, and GlenOak High School.
Ownership History
Date
Name
Owned For
Owner Type
Purchase Details
Closed on
Jul 17, 2023
Sold by
Given Not
Bought by
Eibest Mary Anne
Current Estimated Value
Purchase Details
Closed on
Mar 3, 2022
Sold by
Eibest John L
Bought by
Eibest Mary Anne
Purchase Details
Closed on
Mar 1, 2022
Sold by
Eibest John L
Bought by
Eibest Mary Anne
Purchase Details
Closed on
Feb 25, 2005
Sold by
Whitestone Properties Llc
Bought by
Eibest John L and Eibest Mary Anne
Purchase Details
Closed on
Sep 8, 2004
Sold by
Johnson Hartley W and Johnson Geraldine W
Bought by
White Stone Properties Llc
Home Financials for this Owner
Home Financials are based on the most recent Mortgage that was taken out on this home.
Original Mortgage
$139,200
Interest Rate
6.17%
Mortgage Type
Purchase Money Mortgage
Purchase Details
Closed on
Dec 4, 2001
Sold by
Regal Construction Co
Bought by
Johnson Hartley W and Johnson Geraldine W
Create a Home Valuation Report for This Property
The Home Valuation Report is an in-depth analysis detailing your home's value as well as a comparison with similar homes in the area
Home Values in the Area
Average Home Value in this Area
Purchase History
| Date | Buyer | Sale Price | Title Company |
|---|---|---|---|
| Eibest John L | $179,000 | -- | |
| White Stone Properties Llc | $174,000 | -- | |
| Johnson Hartley W | $171,900 | -- |
Source: Public Records
Mortgage History
| Date | Status | Borrower | Loan Amount |
|---|---|---|---|
| Previous Owner | White Stone Properties Llc | $139,200 | |
| Previous Owner | Johnson Geraldine W | $170,100 |
Source: Public Records
Tax History Compared to Growth
Tax History
| Year | Tax Paid | Tax Assessment Tax Assessment Total Assessment is a certain percentage of the fair market value that is determined by local assessors to be the total taxable value of land and additions on the property. | Land | Improvement |
|---|---|---|---|---|
| 2024 | -- | $96,330 | $27,760 | $68,570 |
| 2023 | $3,065 | $74,240 | $20,090 | $54,150 |
| 2022 | $3,080 | $74,240 | $20,090 | $54,150 |
| 2021 | $3,097 | $74,240 | $20,090 | $54,150 |
| 2020 | $2,835 | $63,290 | $17,330 | $45,960 |
| 2019 | $2,818 | $63,290 | $17,330 | $45,960 |
| 2018 | $2,784 | $63,290 | $17,330 | $45,960 |
| 2017 | $2,826 | $59,610 | $15,230 | $44,380 |
| 2016 | $2,834 | $59,610 | $15,230 | $44,380 |
| 2015 | $1,374 | $59,610 | $15,230 | $44,380 |
| 2014 | $496 | $53,840 | $13,760 | $40,080 |
| 2013 | $1,262 | $55,520 | $13,760 | $41,760 |
Source: Public Records
Map
Nearby Homes
- 1103 Stone Crossing St NE
- 6693 Harrington Court Ave NE
- 1512 Gate House St NE
- 1572 Gate House St NE
- 6804 Harrington Court Ave NE
- 1614 Bellview St NE
- 1524 Eagle Watch St NE
- 6630 Market Ave N
- 6831 Harrington Court Ave NE
- 119 Stone Crossing St NE
- 2030 Wynstone Cir NE
- 1955 Wendover Cir NE
- 1344 Applegrove St NE
- 6111 Hollydale Ave NE
- 1818 Steiner St NW
- 0 Market Ave N Unit 5100095
- 0 Market Ave N Unit 5100088
- 1224 Marquardt Ave NW
- 1216 Marquardt Ave NW
- 1820 Schneider St NW
- 1240 White Stone Cir NE
- 1244 White Stone Cir NE
- 1236 White Stone Cir NE
- 1248 White Stone Cir NE
- 1228 White Stone Cir NE
- 6613 Harvest Ridge Ave NE
- 6607 Harvest Ridge Ave NE
- 1254 White Stone Cir NE
- 6619 Harvest Ridge Ave NE
- 1253 White Stone Cir NE
- 1222 White Stone Cir NE
- 6625 Harvest Ridge Ave NE
- 1260 White Stone Cir NE
- 1261 White Stone Cir NE
- 1214 White Stone Cir NE
- 6633 Harvest Ridge Ave NE
- V/L Bellview St NE
- 1221 White Stone Cir NE
- 1268 White Stone Cir NE
- 6639 Harvest Ridge Ave NE