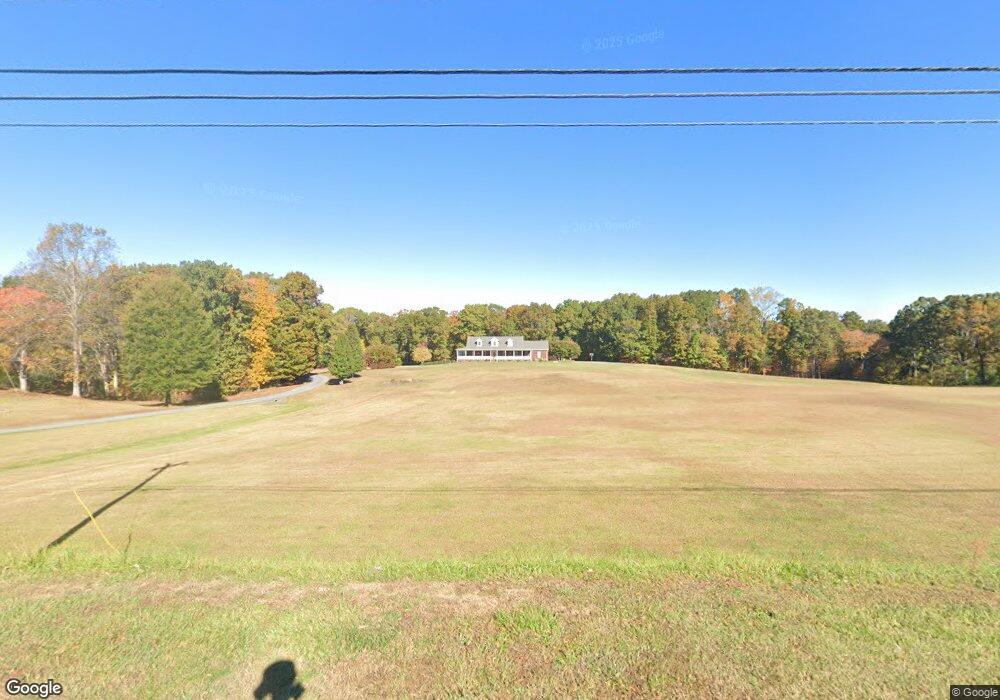
12403 N Carolina 24 Locust, NC 28097
Estimated Value: $542,000 - $677,000
3
Beds
3
Baths
3,187
Sq Ft
$189/Sq Ft
Est. Value
About This Home
This home is located at 12403 N Carolina 24, Locust, NC 28097 and is currently estimated at $602,608, approximately $189 per square foot. 12403 N Carolina 24 is a home located in Stanly County with nearby schools including Locust Elementary School, West Stanly Middle School, and West Stanly High School.
Ownership History
Date
Name
Owned For
Owner Type
Purchase Details
Closed on
Jun 16, 2021
Sold by
Flowe James Mitchell and Flowe Jennifer Simpson
Bought by
Hogan William L and Hogan Toni H
Current Estimated Value
Purchase Details
Closed on
Jan 1, 2012
Bought by
Flowe James M and Flowe Jennifer S
Purchase Details
Closed on
Sep 28, 2011
Sold by
Hogan William L and Hogan Toni H
Bought by
Flowe James M and Flowe Jennifer S
Home Financials for this Owner
Home Financials are based on the most recent Mortgage that was taken out on this home.
Original Mortgage
$275,000
Interest Rate
4.24%
Mortgage Type
New Conventional
Purchase Details
Closed on
Feb 7, 2008
Sold by
Simpson Jennifer H and Simpson Joshua H
Bought by
Hogan William L and Hogan Toni H
Create a Home Valuation Report for This Property
The Home Valuation Report is an in-depth analysis detailing your home's value as well as a comparison with similar homes in the area
Home Values in the Area
Average Home Value in this Area
Purchase History
| Date | Buyer | Sale Price | Title Company |
|---|---|---|---|
| Hogan William L | $400,500 | None Available | |
| Flowe James M | -- | -- | |
| Flowe James M | $344,000 | None Available | |
| Hogan William L | $265,000 | None Available |
Source: Public Records
Mortgage History
| Date | Status | Borrower | Loan Amount |
|---|---|---|---|
| Previous Owner | Flowe James M | $275,000 |
Source: Public Records
Tax History Compared to Growth
Tax History
| Year | Tax Paid | Tax Assessment Tax Assessment Total Assessment is a certain percentage of the fair market value that is determined by local assessors to be the total taxable value of land and additions on the property. | Land | Improvement |
|---|---|---|---|---|
| 2025 | $3,566 | $566,059 | $113,380 | $452,679 |
| 2024 | $2,912 | $398,840 | $73,405 | $325,435 |
| 2023 | $3,009 | $398,840 | $73,405 | $325,435 |
| 2022 | $2,969 | $398,840 | $73,405 | $325,435 |
| 2021 | $2,927 | $398,840 | $73,405 | $325,435 |
| 2020 | $2,787 | $353,969 | $62,015 | $291,954 |
| 2019 | $2,811 | $353,969 | $62,015 | $291,954 |
| 2018 | $2,726 | $353,969 | $62,015 | $291,954 |
| 2017 | $2,726 | $353,969 | $62,015 | $291,954 |
| 2016 | $2,602 | $337,905 | $56,385 | $281,520 |
| 2015 | $2,645 | $337,905 | $56,385 | $281,520 |
| 2014 | $2,590 | $337,905 | $56,385 | $281,520 |
Source: Public Records
Map
Nearby Homes
- 1608 Main St
- 16218 Barbee Rd
- 17826 Brattain Rd
- 00 S Beverly Dr
- 24990 Birdhouse Ln Unit 4
- 128 Hickory Ridge Dr
- 124 Hickory Ridge Dr
- 203 Vanderbilt Blvd
- 606 Elm St
- 0000 Joes Rd
- 13253 Austin Rd
- 13271 Austin Rd
- 13768 Saint Thomas Dr
- Red Cedar Plan at Running Creek
- Rainier Plan at Running Creek
- Elliott Plan at Running Creek
- Roosevelt Plan at Running Creek
- 13801 Saint Thomas Dr
- 14740 Hatley Burris Rd
- 319 N Central Ave
- 12403 Nc 24 27 Hwy
- 12393 Nc 24 27 Hwy
- 12447 Nc 24 27 Hwy
- 12375 Nc 24 27 Hwy
- 12365 Nc 24 27 Hwy
- 12420 Nc 24 27 Hwy
- 12396 Nc 24 27 Hwy
- 12365 Nc-27
- 12430 Nc 24 27 Hwy
- 00 Mary Ln
- 000 Mary Ln Unit 1
- 000 Mary Ln
- 999 Mary Ln
- 123 Providence St
- 16348 Barbee Rd
- 12337 Nc 24 27 Hwy
- VAC Providence St Unit 23
- 219 Providence St
- 16332 Barbee Rd
- 12317 Nc 24 27 Hwy