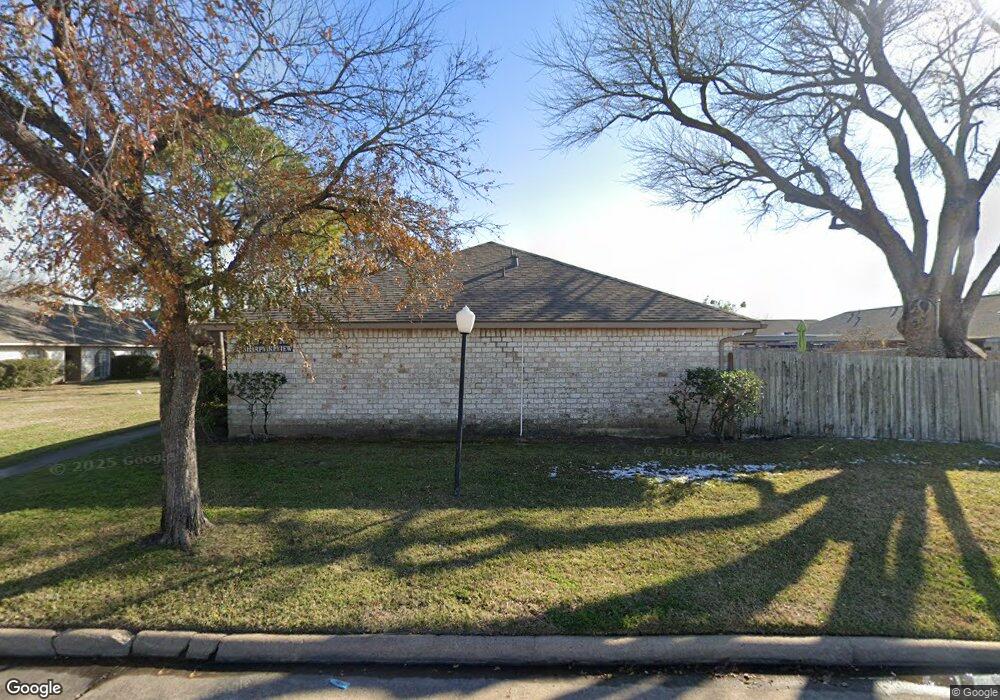
12405 Sharpview Dr Unit 2405 Houston, TX 77072
Alief NeighborhoodEstimated Value: $132,000 - $157,000
2
Beds
2
Baths
1,472
Sq Ft
$99/Sq Ft
Est. Value
About This Home
This home is located at 12405 Sharpview Dr Unit 2405, Houston, TX 77072 and is currently estimated at $145,749, approximately $99 per square foot. 12405 Sharpview Dr Unit 2405 is a home located in Harris County with nearby schools including Youens Elementary School, Youngblood Intermediate School, and Hastings High School.
Ownership History
Date
Name
Owned For
Owner Type
Purchase Details
Closed on
Dec 16, 2016
Sold by
Shade Tree Holdings Lp
Bought by
Tidmore Max G
Current Estimated Value
Purchase Details
Closed on
Mar 11, 2005
Sold by
Shade Tree Holdings Lp
Bought by
Moreno Sandra E and Moreno Jorge G
Home Financials for this Owner
Home Financials are based on the most recent Mortgage that was taken out on this home.
Original Mortgage
$54,900
Interest Rate
6.6%
Mortgage Type
Seller Take Back
Purchase Details
Closed on
Nov 12, 2004
Sold by
Riggs Laurie K and Riggs Wayland A
Bought by
Shade Tree Holdings Lp
Home Financials for this Owner
Home Financials are based on the most recent Mortgage that was taken out on this home.
Original Mortgage
$45,500
Interest Rate
5.7%
Mortgage Type
Purchase Money Mortgage
Create a Home Valuation Report for This Property
The Home Valuation Report is an in-depth analysis detailing your home's value as well as a comparison with similar homes in the area
Home Values in the Area
Average Home Value in this Area
Purchase History
| Date | Buyer | Sale Price | Title Company |
|---|---|---|---|
| Tidmore Max G | -- | None Available | |
| Moreno Sandra E | -- | None Available | |
| Shade Tree Holdings Lp | -- | American Title Co |
Source: Public Records
Mortgage History
| Date | Status | Borrower | Loan Amount |
|---|---|---|---|
| Previous Owner | Moreno Sandra E | $54,900 | |
| Previous Owner | Shade Tree Holdings Lp | $45,500 |
Source: Public Records
Tax History
| Year | Tax Paid | Tax Assessment Tax Assessment Total Assessment is a certain percentage of the fair market value that is determined by local assessors to be the total taxable value of land and additions on the property. | Land | Improvement |
|---|---|---|---|---|
| 2025 | $3,204 | $134,344 | $40,000 | $94,344 |
| 2024 | $3,204 | $141,054 | $40,000 | $101,054 |
| 2023 | $3,204 | $142,369 | $40,000 | $102,369 |
| 2022 | $2,959 | $121,988 | $30,000 | $91,988 |
| 2021 | $2,569 | $105,231 | $20,000 | $85,231 |
| 2020 | $2,621 | $103,636 | $20,000 | $83,636 |
| 2019 | $2,486 | $98,082 | $20,000 | $78,082 |
| 2018 | $971 | $74,421 | $15,000 | $59,421 |
| 2017 | $2,029 | $74,421 | $15,000 | $59,421 |
| 2016 | $2,029 | $74,421 | $15,000 | $59,421 |
| 2015 | $1,433 | $74,421 | $15,000 | $59,421 |
| 2014 | $1,433 | $54,009 | $15,000 | $39,009 |
Source: Public Records
Map
Nearby Homes
- 12469 Sharpview Dr Unit 2469
- 7148 Crownwest St Unit 7148
- 7322 Crownwest St Unit 7322
- 7267 Cook Rd
- 12223 Sharpview Dr
- 7335 Cook Rd
- 12133 Sharpview Dr
- 12333 Corona Ln
- 7204 S Dairy Ashford Rd
- 12503 Autumn Leaf Ln
- 7489 Cook Rd
- 12709 Carvel Ln
- 12329 Ridgeside Dr
- 12319 Ridgeside Dr
- 12743 Leader St
- 12524 Pebblestone St
- 7824 Windward Passage St
- 12412 Garden Estate St
- 12022 Stroud Dr
- 12517 Manor Ct
- 12403 Sharpview Dr Unit 2403
- 12407 Sharpview Dr Unit 2407
- 12409 Sharpview Dr Unit 2409
- 12425 Sharpview Dr Unit 2425
- 12427 Sharpview Dr Unit 2427
- 12423 Sharpview Dr Unit 2423
- 12421 Sharpview Dr Unit 2421
- 12373 Sharpview Dr Unit 2373
- 12369 Sharpview Dr Unit 2369
- 12413 Sharpview Dr Unit 2413
- 12411 Sharpview Dr Unit 2411
- 12415 Sharpview Dr Unit 2415
- 12367 Sharpview Dr Unit 2367
- 12417 Sharpview Dr Unit 2417
- 12365 Sharpview Dr Unit 2365
- 12419 Sharpview Dr
- 12357 Sharpview Dr Unit 2357
- 12355 Sharpview Dr Unit 2355
- 12359 Sharpview Dr Unit 9
- 12431 Sharpview Dr Unit 2431
Your Personal Tour Guide
Ask me questions while you tour the home.