A
Landlord's Agent in 2026
Amy Phuong Huynh
B & W Realty Group LLC
(713) 305-7702
2 in this area
23 Total Sales

Estimated Value: $132,000 - $157,000
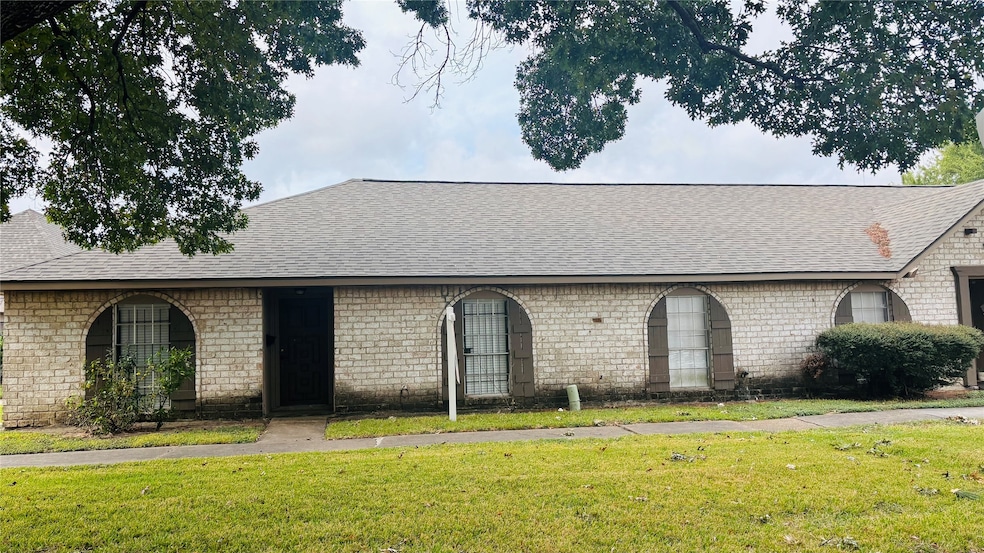
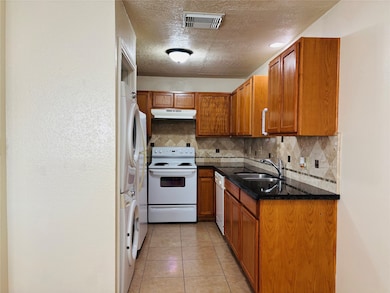
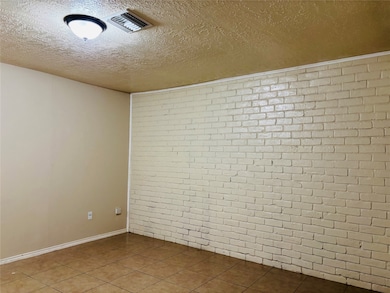
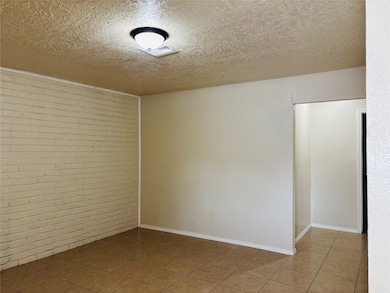
Welcome to a very nice and cozy townhome with 3 bedrooms, 2 full bathrooms in a quiet neighborhood. Very convenient to shopping, restaurant, and a minute away from the major freeways: Beltway 8, 59/69, Westpark Toll road.
Last Agent to Rent the Property
B & W Realty Group LLC License #0716115 Listed on: 11/22/2025
Last Renter's Agent
Nan & Company Properties - Corporate Office (Heights) License #0799100

| Date | Buyer | Sale Price | Title Company |
|---|---|---|---|
| Nguyen Hung Phi | -- | First American Title | |
| Ngo Vien | $48,000 | Brahma Title & Escrow | |
| Federal National Mortgage Association | $39,000 | None Available | |
| Chesney William S | $1,000 | None Available | |
| Lopez Maria | -- | Title Stream | |
| Lopez Maria | -- | -- |
| Date | Status | Borrower | Loan Amount |
|---|---|---|---|
| Open | Nguyen Hung Phi | $100,000 | |
| Previous Owner | Lopez Maria | $94,500 |
| Date | Event | Price | List to Sale | Price per Sq Ft |
|---|---|---|---|---|
| 01/17/2026 01/17/26 | Rented | $1,500 | 0.0% | -- |
| 01/14/2026 01/14/26 | Under Contract | -- | -- | -- |
| 11/22/2025 11/22/25 | For Rent | $1,500 | -- | -- |
| Year | Tax Paid | Tax Assessment Tax Assessment Total Assessment is a certain percentage of the fair market value that is determined by local assessors to be the total taxable value of land and additions on the property. | Land | Improvement |
|---|---|---|---|---|
| 2025 | $3,072 | $135,221 | $40,000 | $95,221 |
| 2024 | $3,072 | $135,221 | $40,000 | $95,221 |
| 2023 | $3,072 | $132,877 | $40,000 | $92,877 |
| 2022 | $2,828 | $116,564 | $30,000 | $86,564 |
| 2021 | $2,324 | $95,197 | $20,000 | $75,197 |
| 2020 | $2,128 | $84,129 | $20,000 | $64,129 |
| 2019 | $2,641 | $95,899 | $20,000 | $75,899 |
| 2018 | $975 | $73,337 | $15,000 | $58,337 |
| 2017 | $2,000 | $73,337 | $15,000 | $58,337 |
| 2016 | $1,601 | $58,696 | $15,000 | $43,696 |
| 2015 | $1,130 | $47,970 | $15,000 | $32,970 |
| 2014 | $1,130 | $42,584 | $15,000 | $27,584 |
A
Landlord's Agent in 2026
Amy Phuong Huynh
B & W Realty Group LLC
(713) 305-7702
2 in this area
23 Total Sales
K
Tenant's Agent in 2026
Karina Morales
Nan & Company Properties - Corporate Office (Heights)
(832) 870-3225
16 Total Sales
Source: Houston Association of REALTORS®
MLS Number: 57299173
APN: 1031940010409
Disclaimer: Certain information contained herein is derived from information provided by parties other than Homes.com. All information provided is deemed reliable, but is not guaranteed to be accurate and should be independently verified.
![]() Copyright 2026, Houston REALTORS® Information Service, Inc.
Copyright 2026, Houston REALTORS® Information Service, Inc.
The information provided is exclusively for consumers’ personal, non-commercial use, and may not be used for any purpose other than to identify prospective properties consumers may be interested in purchasing.
Information is deemed reliable but not guaranteed.
Ask me questions while you tour the home.