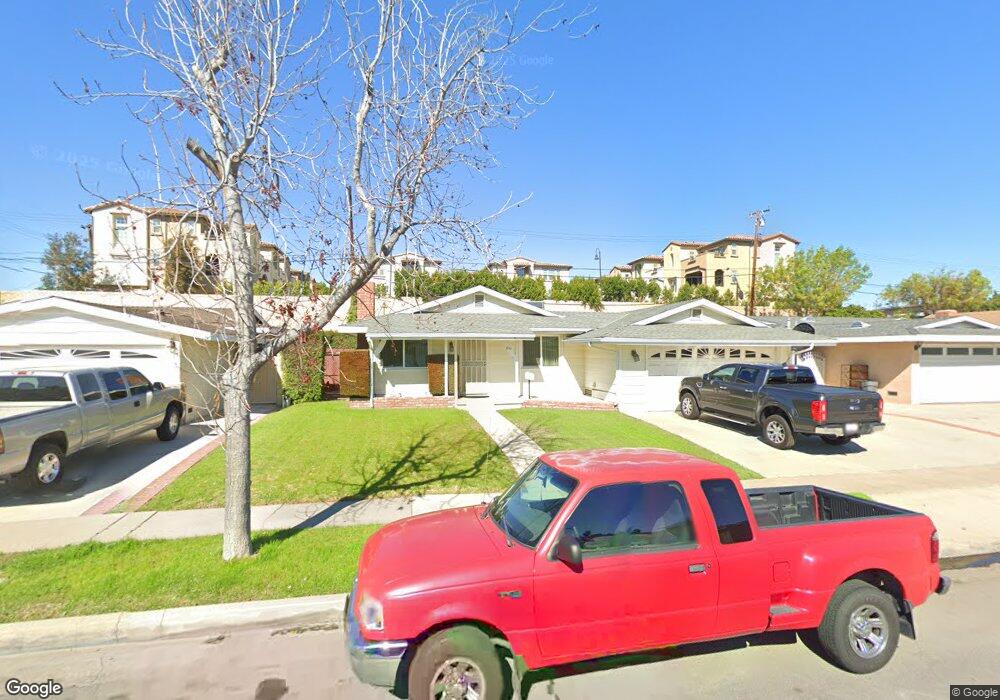
1241 Lorella Ave La Habra, CA 90631
Estimated Value: $790,322 - $868,000
3
Beds
2
Baths
1,122
Sq Ft
$724/Sq Ft
Est. Value
About This Home
This home is located at 1241 Lorella Ave, La Habra, CA 90631 and is currently estimated at $812,081, approximately $723 per square foot. 1241 Lorella Ave is a home located in Orange County with nearby schools including Las Positas Elementary School, Imperial Middle School, and La Habra High School.
Create a Home Valuation Report for This Property
The Home Valuation Report is an in-depth analysis detailing your home's value as well as a comparison with similar homes in the area
Home Values in the Area
Average Home Value in this Area
Tax History Compared to Growth
Tax History
| Year | Tax Paid | Tax Assessment Tax Assessment Total Assessment is a certain percentage of the fair market value that is determined by local assessors to be the total taxable value of land and additions on the property. | Land | Improvement |
|---|---|---|---|---|
| 2025 | $1,186 | $81,698 | $36,042 | $45,656 |
| 2024 | $1,186 | $80,097 | $35,336 | $44,761 |
| 2023 | $1,154 | $78,527 | $34,643 | $43,884 |
| 2022 | $1,134 | $76,988 | $33,964 | $43,024 |
| 2021 | $1,115 | $75,479 | $33,298 | $42,181 |
| 2020 | $1,104 | $74,706 | $32,957 | $41,749 |
| 2019 | $1,080 | $73,242 | $32,311 | $40,931 |
| 2018 | $1,062 | $71,806 | $31,677 | $40,129 |
| 2017 | $1,043 | $70,399 | $31,056 | $39,343 |
| 2016 | $1,020 | $69,019 | $30,447 | $38,572 |
| 2015 | $994 | $67,983 | $29,990 | $37,993 |
| 2014 | $965 | $66,652 | $29,403 | $37,249 |
Source: Public Records
Map
Nearby Homes
- 1341 W Sunflower
- 237 S Monte Vista St
- 1651 Pine Dr
- 401 Granada Dr
- 1620 W El Portal Dr
- 421 N Marian St
- 1491 W Lambert Rd
- 720 W La Habra Blvd
- 1655 W Lambert Rd Unit J
- 1675 W Lambert Rd Unit 22
- 1921 Pine Dr
- 1310 W Lambert Rd Unit 180
- 1731 W Lambert Rd Unit 91
- 1731 W Lambert Rd Unit 62
- 1470 W Lambert Rd Unit 255
- 501 Willow St
- 221 Chinchilla St
- 1450 W Lambert Rd Unit 358
- 1750 W Lambert Rd Unit 112
- 2000 Baja Ave
- 1231 Lorella Ave
- 1251 Lorella Ave
- 1301 Lorella Ave
- 1221 Lorella Ave
- 1240 Lorella Ave
- 1250 Lorella Ave
- 1230 Lorella Ave
- 150 Colleen St
- 1211 Lorella Ave
- 1311 Lorella Ave
- 1300 Lorella Ave
- 1220 Lorella Ave
- 140 Colleen St
- 151 S Idaho St
- 1310 Lorella Ave
- 1201 Lorella Ave
- 1210 Lorella Ave
- 130 Colleen St
- 1220 W La Habra Blvd Unit 204
- 1220 W La Habra Blvd