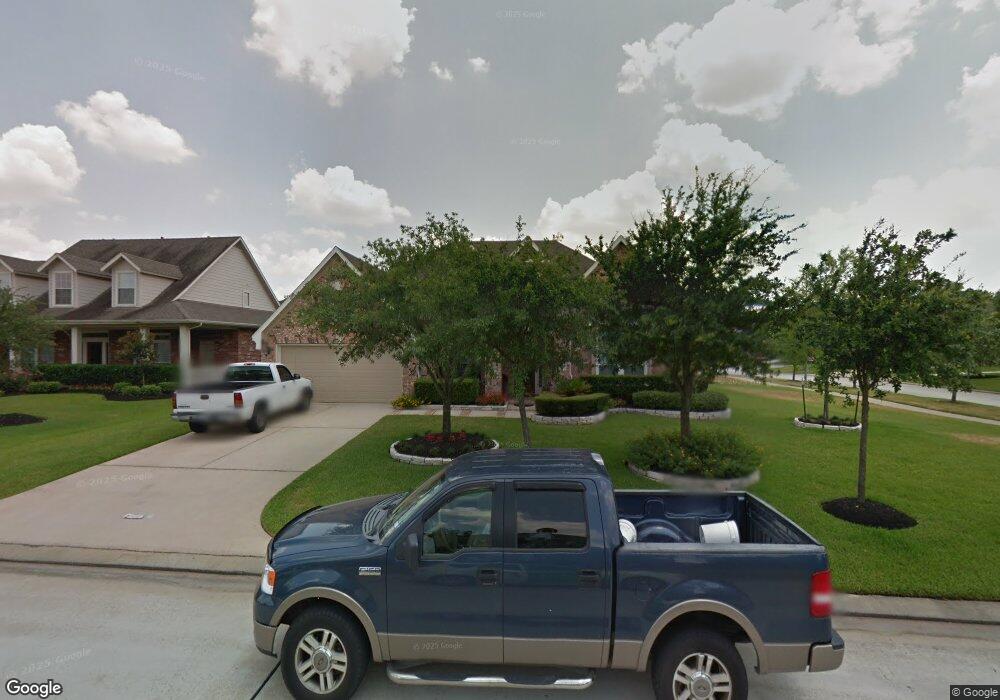
12415 Mossy Woods Dr Tomball, TX 77377
Northpointe NeighborhoodEstimated Value: $526,000 - $587,000
3
Beds
4
Baths
3,820
Sq Ft
$143/Sq Ft
Est. Value
About This Home
This home is located at 12415 Mossy Woods Dr, Tomball, TX 77377 and is currently estimated at $545,544, approximately $142 per square foot. 12415 Mossy Woods Dr is a home located in Harris County with nearby schools including Willow Creek Elementary School, Willow Wood Junior High School, and Northpointe Intermediate School.
Ownership History
Date
Name
Owned For
Owner Type
Purchase Details
Closed on
Sep 15, 2017
Sold by
Rodger Amber G
Bought by
Central Bank
Current Estimated Value
Purchase Details
Closed on
May 7, 2013
Sold by
Norman Wade Carl and Norman Debbie L
Bought by
Snyder Amber G Rodgers
Home Financials for this Owner
Home Financials are based on the most recent Mortgage that was taken out on this home.
Original Mortgage
$270,750
Interest Rate
3.61%
Mortgage Type
New Conventional
Purchase Details
Closed on
May 23, 2003
Sold by
Weekley Homes Lp
Bought by
Norman Wade Carl and Norman Debbie L
Home Financials for this Owner
Home Financials are based on the most recent Mortgage that was taken out on this home.
Original Mortgage
$263,422
Interest Rate
5.79%
Mortgage Type
VA
Purchase Details
Closed on
Jun 11, 2002
Sold by
Lennar Homes Of Texas Land & Const Ltd
Bought by
Weekley Homes Lp
Create a Home Valuation Report for This Property
The Home Valuation Report is an in-depth analysis detailing your home's value as well as a comparison with similar homes in the area
Home Values in the Area
Average Home Value in this Area
Purchase History
| Date | Buyer | Sale Price | Title Company |
|---|---|---|---|
| Central Bank | -- | None Available | |
| Snyder Amber G Rodgers | -- | None Available | |
| Norman Wade Carl | -- | Priority Title Company | |
| Weekley Homes Lp | -- | Priority Title |
Source: Public Records
Mortgage History
| Date | Status | Borrower | Loan Amount |
|---|---|---|---|
| Previous Owner | Snyder Amber G Rodgers | $270,750 | |
| Previous Owner | Norman Wade Carl | $263,422 |
Source: Public Records
Tax History Compared to Growth
Tax History
| Year | Tax Paid | Tax Assessment Tax Assessment Total Assessment is a certain percentage of the fair market value that is determined by local assessors to be the total taxable value of land and additions on the property. | Land | Improvement |
|---|---|---|---|---|
| 2025 | $11,158 | $531,237 | $81,817 | $449,420 |
| 2024 | $11,158 | $527,100 | $77,186 | $449,914 |
| 2023 | $11,158 | $517,992 | $69,467 | $448,525 |
| 2022 | $11,137 | $459,303 | $61,749 | $397,554 |
| 2021 | $10,493 | $380,656 | $50,171 | $330,485 |
| 2020 | $10,168 | $355,676 | $50,171 | $305,505 |
| 2019 | $10,928 | $371,879 | $46,250 | $325,629 |
| 2018 | $4,264 | $343,192 | $46,250 | $296,942 |
| 2017 | $10,134 | $343,192 | $46,250 | $296,942 |
| 2016 | $10,134 | $343,192 | $46,250 | $296,942 |
| 2015 | $8,663 | $343,192 | $46,250 | $296,942 |
| 2014 | $8,663 | $310,313 | $46,250 | $264,063 |
Source: Public Records
Map
Nearby Homes
- 12427 Pedder Way Dr
- 17511 Pecks Park Ct
- 12730 Holsberry Ct
- 17302 Holsberry Ct
- 12611 Wandering Streams Dr
- 12506 Opal Valley Dr
- 17814 Winkler Willow Ct
- 17623 Edengrove Dr
- 12806 Wandering Streams Dr
- 12802 Mossy Ledge Dr
- 12222 Brighton Brook Ln
- 16723 Chewton Glen St
- 12810 Wondering Forest Dr
- 12703 Songhollow Dr
- 12823 Mossy Ledge Dr
- 17410 Pikes Peek Ct
- 14311 Lakepointe Bend Ln
- 12331 Westwold Dr
- 11815 Lakewood Hills Dr
- 19307 Hillside Pasture Ln
- 12411 Mossy Woods Dr
- 12426 Pedder Way Dr
- 12422 Pedder Way Dr
- 12414 Mossy Woods Dr
- 17315 Village Commons Dr
- 12407 Mossy Woods Dr
- 17311 Village Commons Dr
- 12410 Mossy Woods Dr
- 17319 Village Commons Dr
- 12418 Pedder Way Dr
- 17307 Village Commons Dr
- 12403 Mossy Woods Dr
- 17323 Village Commons Dr
- 12406 Mossy Woods Dr
- 12423 Pedder Way Btsa 3000
- 17303 Village Commons Dr
- 17318 Village Breeze Dr
- 12414 Pedder Way Dr
- 17314 Village Breeze Dr
- 12423 Pedder Way Dr