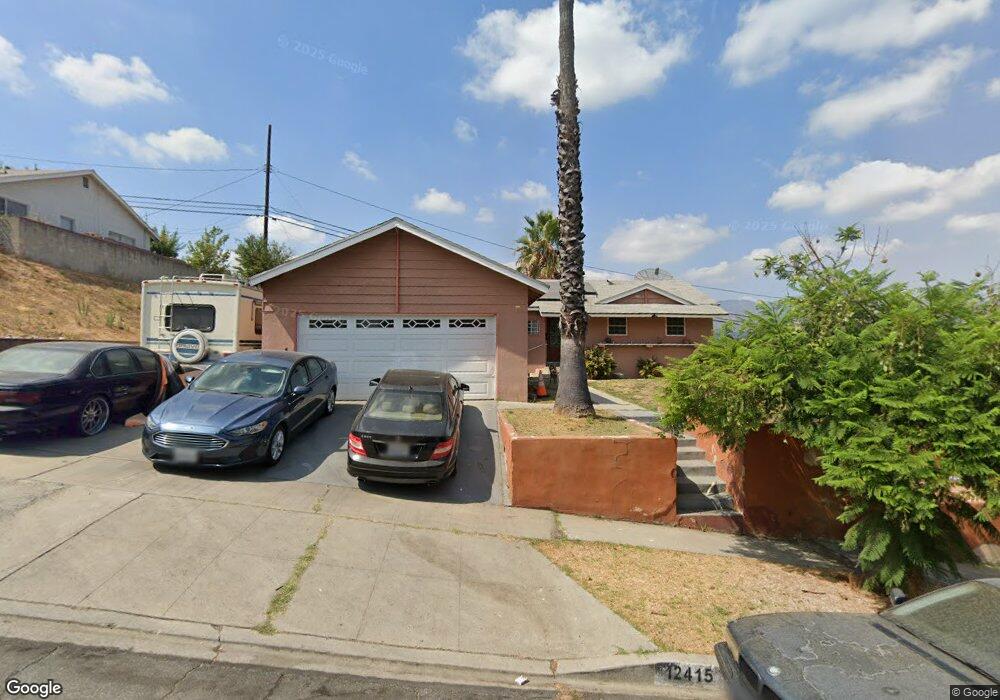
12415 Terra Bella St Pacoima, CA 91331
Estimated Value: $703,762 - $783,000
4
Beds
2
Baths
1,338
Sq Ft
$549/Sq Ft
Est. Value
About This Home
This home is located at 12415 Terra Bella St, Pacoima, CA 91331 and is currently estimated at $734,941, approximately $549 per square foot. 12415 Terra Bella St is a home located in Los Angeles County with nearby schools including Sara Coughlin Elementary School, Charles Maclay Middle School, and San Fernando Senior High School.
Ownership History
Date
Name
Owned For
Owner Type
Purchase Details
Closed on
Jan 30, 2019
Sold by
Moten Robert L and Moten Ruth J
Bought by
Moten Robert L and Moten Ruth J
Current Estimated Value
Purchase Details
Closed on
Jul 5, 2006
Sold by
Moten Robert Leo
Bought by
Moten Robert L and Moten Ruth J
Home Financials for this Owner
Home Financials are based on the most recent Mortgage that was taken out on this home.
Original Mortgage
$254,000
Interest Rate
6.66%
Mortgage Type
New Conventional
Purchase Details
Closed on
May 31, 2001
Sold by
Moten Robert L
Bought by
Moten Robert Leo and Moten Ruth J
Home Financials for this Owner
Home Financials are based on the most recent Mortgage that was taken out on this home.
Original Mortgage
$144,500
Interest Rate
8.75%
Purchase Details
Closed on
Sep 30, 1998
Sold by
Moten Robert L
Bought by
Moten Robert L and Moten Ruth J
Create a Home Valuation Report for This Property
The Home Valuation Report is an in-depth analysis detailing your home's value as well as a comparison with similar homes in the area
Home Values in the Area
Average Home Value in this Area
Purchase History
We collect this data history from publicly available records. To have your information removed, we recommend requesting removal directly through your county’s website.
| Date | Buyer | Sale Price | Title Company |
|---|---|---|---|
| Moten Robert L | -- | None Available | |
| Moten Robert L | -- | Fidelity National Title Co | |
| Moten Robert Leo | -- | Orange Coast Title | |
| Moten Robert L | -- | -- |
Source: Public Records
Mortgage History
We collect this data history from publicly available records. To have your information removed, we recommend requesting removal directly through your county’s website.
| Date | Status | Borrower | Loan Amount |
|---|---|---|---|
| Previous Owner | Moten Robert L | $254,000 | |
| Previous Owner | Moten Robert Leo | $144,500 |
Source: Public Records
Tax History
| Year | Tax Paid | Tax Assessment Tax Assessment Total Assessment is a certain percentage of the fair market value that is determined by local assessors to be the total taxable value of land and additions on the property. | Land | Improvement |
|---|---|---|---|---|
| 2025 | $1,034 | $59,262 | $15,899 | $43,363 |
| 2024 | $1,013 | $58,101 | $15,588 | $42,513 |
| 2023 | $1,000 | $56,963 | $15,283 | $41,680 |
| 2022 | $964 | $55,847 | $14,984 | $40,863 |
| 2021 | $946 | $54,753 | $14,691 | $40,062 |
| 2019 | $923 | $53,131 | $14,256 | $38,875 |
| 2018 | $831 | $52,090 | $13,977 | $38,113 |
| 2016 | $782 | $50,069 | $13,435 | $36,634 |
| 2015 | $773 | $49,318 | $13,234 | $36,084 |
| 2014 | $785 | $48,353 | $12,975 | $35,378 |
Source: Public Records
Map
Nearby Homes
- 11044 Borden Ave
- 12418 Gain St
- 10861 Jamie Ave
- 11030 Chivers Ave
- 10965 Glenoaks Blvd Unit 132
- 10965 Glenoaks Blvd Unit 61
- 12287 Osborne St Unit 13
- 12287 Osborne St Unit 12
- 10648 Empire Dr
- 12647 Terra Bella St
- 12330 Osborne St
- 11150 Glenoaks Blvd Unit 74
- 11150 Glenoaks Blvd Unit 223
- 11150 Glenoaks Blvd Unit 29
- 11150 Glenoaks Blvd Unit 38
- 11150 Glenoaks Blvd Unit 43
- 12500 Carl St
- 12545 Chanute St
- 12120 Terra Bella St
- 11338 Dronfield Ave
- 12425 Terra Bella St
- 12401 Terra Bella St
- 12410 Terra Bella St
- 12420 Terra Bella St
- 12433 Terra Bella St
- 11035 Borden Ave
- 12428 Terra Bella St
- 12400 Terra Bella St
- 12369 Garber St
- 12401 Garber St
- 12353 Garber St
- 10932 Fellows Ave
- 10922 Fellows Ave
- 12436 Terra Bella St
- 10940 Fellows Ave
- 12322 Garber St
- 12409 Garber St
- 12330 Garber St
- 12444 Terra Bella St
- 10948 Fellows Ave
Your Personal Tour Guide
Ask me questions while you tour the home.