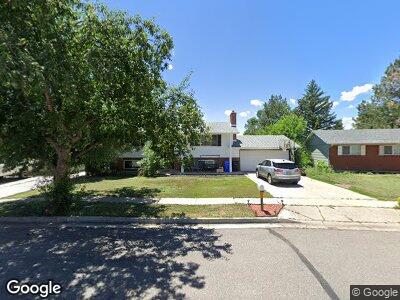
1242 Osgood Rd Colorado Springs, CO 80915
Rustic Hills NeighborhoodEstimated Value: $352,486 - $385,000
3
Beds
2
Baths
1,026
Sq Ft
$357/Sq Ft
Est. Value
About This Home
This home is located at 1242 Osgood Rd, Colorado Springs, CO 80915 and is currently estimated at $366,622, approximately $357 per square foot. 1242 Osgood Rd is a home located in El Paso County with nearby schools including Wilson Elementary School, Sabin Middle School, and Mitchell High School.
Ownership History
Date
Name
Owned For
Owner Type
Purchase Details
Closed on
May 29, 2019
Sold by
Hoyer Jing B and Hoyer Robert J
Bought by
Zufang Llc
Current Estimated Value
Purchase Details
Closed on
Jun 12, 2017
Sold by
Farnum Michelle D
Bought by
Hoyer Jing B and Hoyer Robert J
Home Financials for this Owner
Home Financials are based on the most recent Mortgage that was taken out on this home.
Original Mortgage
$145,237
Interest Rate
4.02%
Mortgage Type
New Conventional
Purchase Details
Closed on
Feb 14, 2011
Sold by
Clark Robert
Bought by
Farnum Michelle D
Home Financials for this Owner
Home Financials are based on the most recent Mortgage that was taken out on this home.
Original Mortgage
$154,481
Interest Rate
4.75%
Mortgage Type
FHA
Purchase Details
Closed on
Jul 14, 1999
Sold by
Snead Anna S
Bought by
The Anna S Snead Family Trust
Purchase Details
Closed on
Oct 1, 1976
Bought by
Hoyer Robert J
Create a Home Valuation Report for This Property
The Home Valuation Report is an in-depth analysis detailing your home's value as well as a comparison with similar homes in the area
Home Values in the Area
Average Home Value in this Area
Purchase History
| Date | Buyer | Sale Price | Title Company |
|---|---|---|---|
| Zufang Llc | -- | None Available | |
| Hoyer Jing B | $181,546 | Unified Title Co | |
| Farnum Michelle D | $158,500 | Heritage Title | |
| The Anna S Snead Family Trust | -- | -- | |
| Hoyer Robert J | -- | -- |
Source: Public Records
Mortgage History
| Date | Status | Borrower | Loan Amount |
|---|---|---|---|
| Previous Owner | Hoyer Jing B | $145,237 | |
| Previous Owner | Farnum Michelle D | $154,481 |
Source: Public Records
Tax History Compared to Growth
Tax History
| Year | Tax Paid | Tax Assessment Tax Assessment Total Assessment is a certain percentage of the fair market value that is determined by local assessors to be the total taxable value of land and additions on the property. | Land | Improvement |
|---|---|---|---|---|
| 2024 | $875 | $22,110 | $4,150 | $17,960 |
| 2023 | $875 | $22,110 | $4,150 | $17,960 |
| 2022 | $1,006 | $17,980 | $3,340 | $14,640 |
| 2021 | $1,092 | $18,500 | $3,430 | $15,070 |
| 2020 | $937 | $13,800 | $3,000 | $10,800 |
| 2019 | $932 | $13,800 | $3,000 | $10,800 |
| 2018 | $1,011 | $13,780 | $2,380 | $11,400 |
| 2017 | $958 | $13,780 | $2,380 | $11,400 |
| 2016 | $758 | $13,070 | $2,310 | $10,760 |
| 2015 | $755 | $13,070 | $2,310 | $10,760 |
| 2014 | $742 | $12,330 | $2,310 | $10,020 |
Source: Public Records
Map
Nearby Homes
- 1342 Mears Dr
- 1401 Martin Dr
- 1306 Waddell Cir
- 4354 E San Miguel St
- 4344 E San Miguel St
- 5102 Galley Rd Unit 118 B
- 4420 Galley Rd
- 1734 Sawyer Way
- 1527 Robidoux Cir
- 1625 N Murray Blvd Unit 230
- 1708 Sawyer Way Unit 178
- 1708 Sawyer Way Unit 182
- 1708 Sawyer Way Unit 176
- 1708 Sawyer Way Unit 167
- 1723 Wooten Rd
- 4012 Maxwell Place
- 4127 Bent Dr
- 711 Bridger Dr
- 5462 Hammond Dr
- 1009 Galley Place