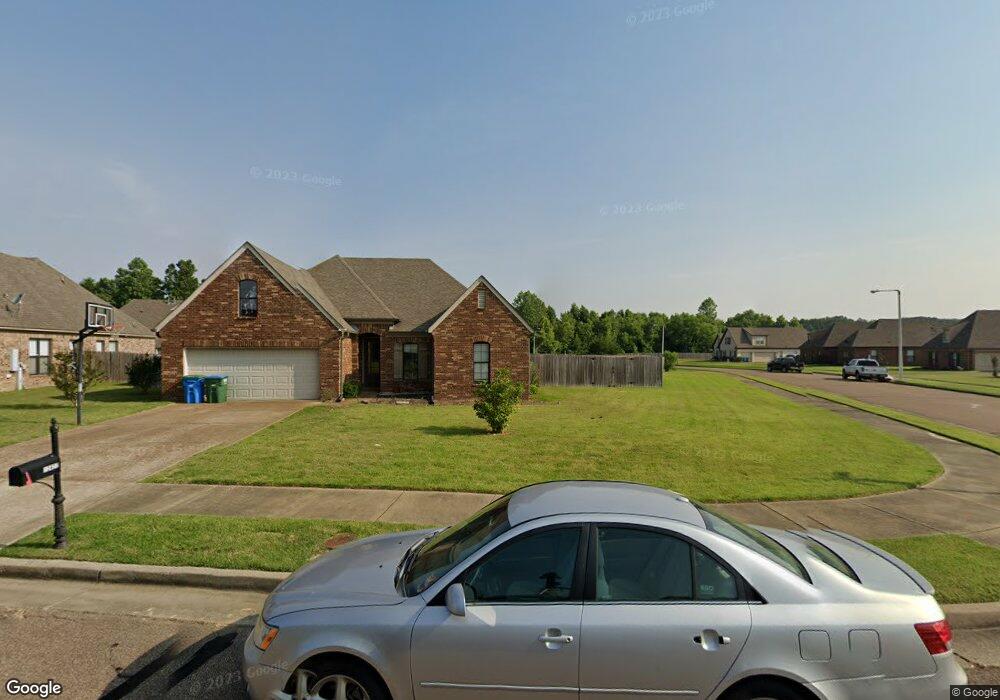
12422 Darton Dr Arlington, TN 38002
Estimated Value: $314,000 - $427,000
4
Beds
3
Baths
2,839
Sq Ft
$139/Sq Ft
Est. Value
About This Home
This home is located at 12422 Darton Dr, Arlington, TN 38002 and is currently estimated at $393,330, approximately $138 per square foot. 12422 Darton Dr is a home located in Shelby County with nearby schools including Arlington Elementary School, Arlington Middle School, and Arlington High School.
Ownership History
Date
Name
Owned For
Owner Type
Purchase Details
Closed on
Sep 11, 2015
Sold by
Melby Eric George
Bought by
Melby Erin Sabel
Current Estimated Value
Purchase Details
Closed on
Sep 28, 2010
Sold by
Keith & David Grant Homes Llc
Bought by
Melby Eric George and Melby Erin
Home Financials for this Owner
Home Financials are based on the most recent Mortgage that was taken out on this home.
Original Mortgage
$202,985
Outstanding Balance
$133,265
Interest Rate
4.25%
Mortgage Type
FHA
Estimated Equity
$260,065
Purchase Details
Closed on
Jul 12, 2010
Sold by
Maple Grove Partners
Bought by
Keith & David Grant Homes Llc
Home Financials for this Owner
Home Financials are based on the most recent Mortgage that was taken out on this home.
Original Mortgage
$162,984
Interest Rate
4.77%
Mortgage Type
Construction
Create a Home Valuation Report for This Property
The Home Valuation Report is an in-depth analysis detailing your home's value as well as a comparison with similar homes in the area
Home Values in the Area
Average Home Value in this Area
Purchase History
| Date | Buyer | Sale Price | Title Company |
|---|---|---|---|
| Melby Erin Sabel | -- | Attorney | |
| Melby Eric George | $205,720 | Realty Title & Escrow Co | |
| Keith & David Grant Homes Llc | $37,500 | Multiple |
Source: Public Records
Mortgage History
| Date | Status | Borrower | Loan Amount |
|---|---|---|---|
| Open | Melby Eric George | $202,985 | |
| Previous Owner | Keith & David Grant Homes Llc | $162,984 |
Source: Public Records
Tax History Compared to Growth
Tax History
| Year | Tax Paid | Tax Assessment Tax Assessment Total Assessment is a certain percentage of the fair market value that is determined by local assessors to be the total taxable value of land and additions on the property. | Land | Improvement |
|---|---|---|---|---|
| 2025 | $2,618 | $102,725 | $20,000 | $82,725 |
| 2024 | $5,236 | $77,225 | $14,300 | $62,925 |
| 2023 | $3,606 | $77,225 | $14,300 | $62,925 |
| 2022 | $1,977 | $77,225 | $14,300 | $62,925 |
| 2021 | $3,653 | $77,225 | $14,300 | $62,925 |
| 2020 | $3,434 | $63,350 | $13,250 | $50,100 |
| 2019 | $2,566 | $63,350 | $13,250 | $50,100 |
| 2018 | $3,294 | $63,350 | $13,250 | $50,100 |
| 2017 | $3,332 | $63,350 | $13,250 | $50,100 |
| 2016 | $2,829 | $51,250 | $0 | $0 |
| 2014 | $2,240 | $51,250 | $0 | $0 |
Source: Public Records
Map
Nearby Homes
- 6392 Milton Wilson Blvd
- 12502 Caymus Ln
- 6320 Dawson Creek Ln
- 6350 Bevan Lake Dr
- 6324 Bevan Lake Dr
- 6318 Bevan Lake Dr
- 6314 Bevan Lake Dr
- 6302 Bevan Lake Dr
- 6284 Bevan Lake Dr
- 12545 Elderton Dr
- 12675 Cambracrest Ln
- 6271 Queens College Dr
- 12260 Afton Place
- 6501 Clarkson Cir W
- 6489 Clarkson Cir W
- 6481 Clarkson Cir W
- 12179 S Shady Tree Ln
- 12775 Mccartney Ln
- 12775 Longmire Loop N
- 12763 Clarkson Cir E
- 12414 Darton Dr
- 12406 Darton Dr
- 12427 Darton Dr
- 12405 Bevan Dr
- 12411 Darton Dr
- 12417 Bevan Dr
- 12438 Darton Dr
- 12397 Bevan Dr
- 12396 Darton Dr
- 6421 Renwood Loop
- 12437 Darton Dr
- 12401 Darton Dr
- 6411 Renwood Loop
- 12387 Bevan Dr
- 6431 Renwood Loop
- 6442 Bevan Dr E
- 12386 Darton Dr
- 12454 Darton Dr
- 12391 Darton Dr
- 12453 Darton Dr