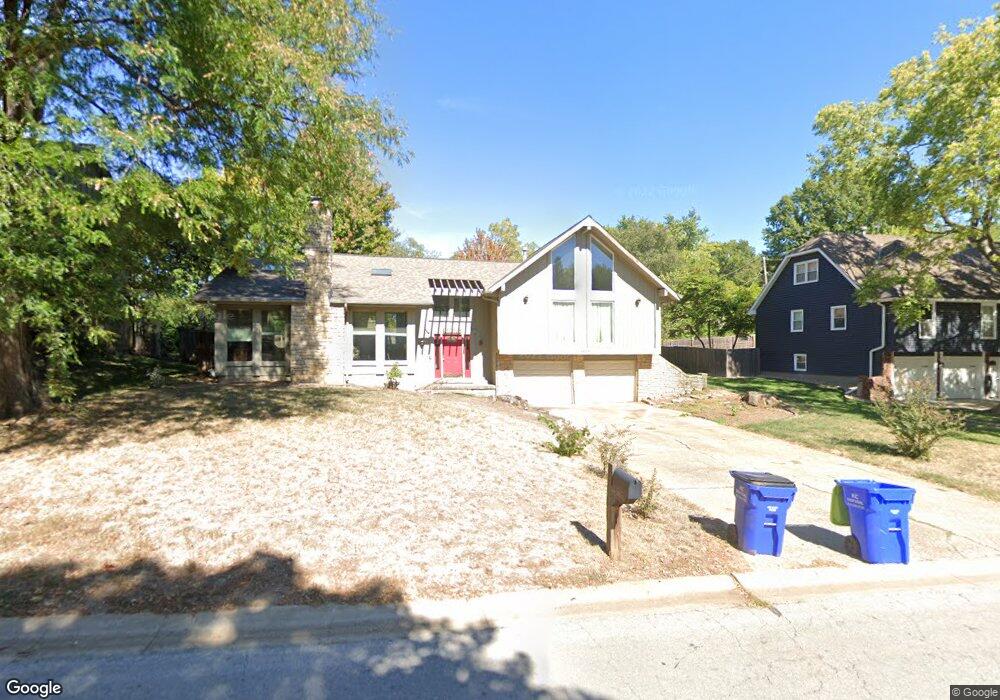
12424 W 69th St Shawnee, KS 66216
Estimated Value: $408,000 - $435,000
4
Beds
3
Baths
2,121
Sq Ft
$198/Sq Ft
Est. Value
About This Home
This home is located at 12424 W 69th St, Shawnee, KS 66216 and is currently estimated at $420,148, approximately $198 per square foot. 12424 W 69th St is a home located in Johnson County with nearby schools including Rhein Benninghoven Elementary School, Trailridge Middle School, and Shawnee Mission Northwest High School.
Ownership History
Date
Name
Owned For
Owner Type
Purchase Details
Closed on
Sep 29, 2020
Sold by
Brophy Kelly Ann
Bought by
Busenhart Chris
Current Estimated Value
Purchase Details
Closed on
Sep 20, 2006
Sold by
Kraxner David J and Kraxner Holly J
Bought by
Erophy Kelly Ann
Home Financials for this Owner
Home Financials are based on the most recent Mortgage that was taken out on this home.
Original Mortgage
$196,455
Interest Rate
6.55%
Mortgage Type
New Conventional
Purchase Details
Closed on
Aug 25, 2003
Sold by
Cansler Kimberly J and Cansler Steven R
Bought by
Kraxner David J
Home Financials for this Owner
Home Financials are based on the most recent Mortgage that was taken out on this home.
Original Mortgage
$161,600
Interest Rate
5.87%
Mortgage Type
Purchase Money Mortgage
Create a Home Valuation Report for This Property
The Home Valuation Report is an in-depth analysis detailing your home's value as well as a comparison with similar homes in the area
Home Values in the Area
Average Home Value in this Area
Purchase History
| Date | Buyer | Sale Price | Title Company |
|---|---|---|---|
| Busenhart Chris | -- | None Available | |
| Brophy Kelly Ann | -- | None Listed On Document | |
| Erophy Kelly Ann | -- | Chicago Title Ins Co | |
| Kraxner David J | -- | Security Land Title Company |
Source: Public Records
Mortgage History
| Date | Status | Borrower | Loan Amount |
|---|---|---|---|
| Previous Owner | Erophy Kelly Ann | $196,455 | |
| Previous Owner | Kraxner David J | $161,600 | |
| Closed | Kraxner David J | $40,400 |
Source: Public Records
Tax History Compared to Growth
Tax History
| Year | Tax Paid | Tax Assessment Tax Assessment Total Assessment is a certain percentage of the fair market value that is determined by local assessors to be the total taxable value of land and additions on the property. | Land | Improvement |
|---|---|---|---|---|
| 2024 | $4,464 | $42,136 | $8,302 | $33,834 |
| 2023 | $4,236 | $39,503 | $8,302 | $31,201 |
| 2022 | $3,820 | $35,500 | $7,215 | $28,285 |
| 2021 | $3,836 | $33,465 | $6,560 | $26,905 |
| 2020 | $3,696 | $31,820 | $5,959 | $25,861 |
| 2019 | $3,411 | $29,337 | $5,425 | $23,912 |
| 2018 | $3,396 | $29,095 | $5,425 | $23,670 |
| 2017 | $3,262 | $27,508 | $4,714 | $22,794 |
| 2016 | $3,109 | $25,875 | $4,714 | $21,161 |
| 2015 | $2,778 | $24,001 | $4,714 | $19,287 |
| 2013 | -- | $23,817 | $4,714 | $19,103 |
Source: Public Records
Map
Nearby Homes
- 12300 W 67th Terrace
- Augusta Plan at Kenneth Estates
- Newport Plan at Kenneth Estates
- Rosemount II Plan at Kenneth Estates
- The Avala Villa Plan at Kenneth Estates
- The Rosemount Villa Plan at Kenneth Estates
- Catalina II Plan at Kenneth Estates
- The Avala Plan at Kenneth Estates
- 12811 W 71st St
- 7130 Westgate St
- 6564 Charles St
- 6610 Halsey St
- 7105 Richards Dr
- 6556 Charles St
- 12914 W 67th St
- 7115 Richards Dr
- 13100 W 72nd St
- 12403 W 72nd Terrace
- 11637 W 68th Terrace
- 12225 W 64th Terrace
- 12420 W 69th St
- 12500 W 69th St
- 12421 W 68th Terrace
- 12504 W 69th St
- 12414 W 69th St
- 6901 Long Ave
- 12417 W 68th Terrace
- 12421 W 69th St
- 12508 W 69th St
- 12408 W 69th St
- 6900 Long Ave
- 12415 W 69th St
- 6905 Long Ave
- 12413 W 68th Terrace
- 12602 W 69th St
- 12420 W 68th Terrace
- 12507 W 69th St
- 12409 W 69th St
- 12409 W 68th Terrace
- 12404 W 69th St