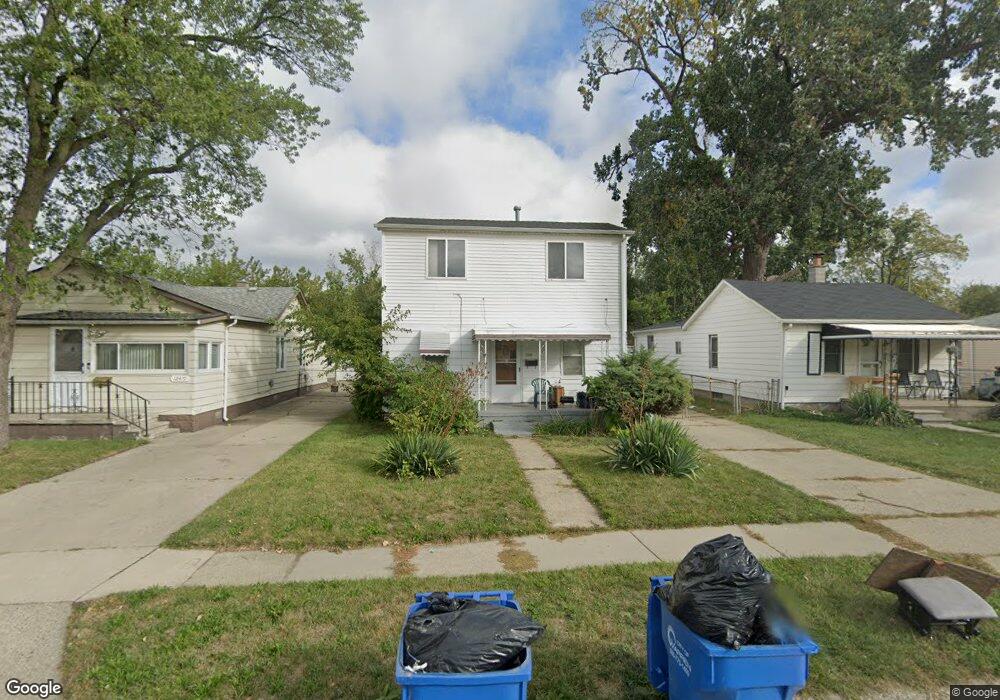
12429 Sherman Ave Unit Bldg-Unit Warren, MI 48089
Southeast Warren NeighborhoodEstimated Value: $66,000 - $111,779
3
Beds
1
Bath
1,012
Sq Ft
$93/Sq Ft
Est. Value
About This Home
This home is located at 12429 Sherman Ave Unit Bldg-Unit, Warren, MI 48089 and is currently estimated at $94,195, approximately $93 per square foot. 12429 Sherman Ave Unit Bldg-Unit is a home located in Macomb County with nearby schools including Lincoln Middle School, Lincoln High School, and Trix Academy.
Ownership History
Date
Name
Owned For
Owner Type
Purchase Details
Closed on
Oct 5, 2021
Sold by
Equity Trust Company
Bought by
Hundiyil Tomas
Current Estimated Value
Purchase Details
Closed on
Feb 16, 2018
Sold by
Prime Acquistitions Llc
Bought by
Equity Trust Company and James David Grenier Traditional Ira
Purchase Details
Closed on
May 22, 2017
Sold by
Blue Moon Acquisitions Llc
Bought by
Prime Acquisitions Llc
Purchase Details
Closed on
Apr 10, 2017
Sold by
Blue Moon Acquisltons Llc
Bought by
Frime Acquisitlons Llc
Purchase Details
Closed on
Mar 10, 2017
Sold by
Fannie Mae
Bought by
Blue Moon Acquisitions Llc
Purchase Details
Closed on
Dec 16, 2016
Sold by
Clark Linda S and Clark Linda
Bought by
Federal National Mortgage Association and Fannie Mae
Create a Home Valuation Report for This Property
The Home Valuation Report is an in-depth analysis detailing your home's value as well as a comparison with similar homes in the area
Home Values in the Area
Average Home Value in this Area
Purchase History
| Date | Buyer | Sale Price | Title Company |
|---|---|---|---|
| Hundiyil Tomas | $76,000 | None Available | |
| Equity Trust Company | $56,000 | Ata National Title Group Llc | |
| Prime Acquisitions Llc | -- | None Available | |
| Frime Acquisitlons Llc | -- | None Available | |
| Blue Moon Acquisitions Llc | $20,680 | Chicago Title Insurance Comp | |
| Federal National Mortgage Association | $15,000 | None Available |
Source: Public Records
Tax History Compared to Growth
Tax History
| Year | Tax Paid | Tax Assessment Tax Assessment Total Assessment is a certain percentage of the fair market value that is determined by local assessors to be the total taxable value of land and additions on the property. | Land | Improvement |
|---|---|---|---|---|
| 2025 | $2,085 | $43,940 | $0 | $0 |
| 2024 | $2,041 | $36,440 | $0 | $0 |
| 2023 | $1,961 | $30,830 | $0 | $0 |
| 2022 | $1,922 | $26,360 | $0 | $0 |
| 2021 | $1,703 | $24,850 | $0 | $0 |
| 2020 | $1,664 | $22,930 | $0 | $0 |
| 2019 | $1,620 | $22,420 | $0 | $0 |
| 2018 | $1,525 | $22,600 | $0 | $0 |
| 2017 | $1,118 | $22,080 | $2,080 | $20,000 |
| 2016 | $917 | $22,080 | $0 | $0 |
| 2015 | $456 | $22,710 | $0 | $0 |
| 2013 | $735 | $14,670 | $0 | $0 |
Source: Public Records
Map
Nearby Homes
- 12444 Vernon Ave
- 12755 Sarsfield Ave
- 12777 Sherman Ave
- 20806 Helle Ave
- 20850 Waltham Rd
- 12754 Georgiana Ave
- 20795 Helle Ave
- 12850 Sidonie Ave
- 12861 Georgiana Ave
- 12856 Couwlier Ave
- 13069 Sarsfield Ave
- 20543 Waltham St
- 20545 Hamburg St
- 20560 Dresden St
- 20520 Dresden St
- 20310 Hamburg St
- 20296 Waltham St
- 20264 Waltham St
- 13388 Vernon Ave
- 20561 Alcoy St
- 12429 Sherman Ave
- 12419 Sherman Ave
- 12435 Sherman Ave
- 12403 Sherman Ave
- 12439 Sherman Ave
- 12451 Sherman Ave
- 12436 Prospect Ave
- 12400 Prospect Ave
- 12446 Prospect Ave
- 12384 Prospect Ave
- 12464 Prospect Ave
- 12428 Sherman Ave
- 12434 Sherman Ave
- 12420 Sherman Ave
- 12475 Sherman Ave
- 2491 Sherman Ave Unit 2510
- 12440 Sherman Ave
- 12474 Prospect Ave
- 12452 Sherman Ave
- 12404 Sherman Ave