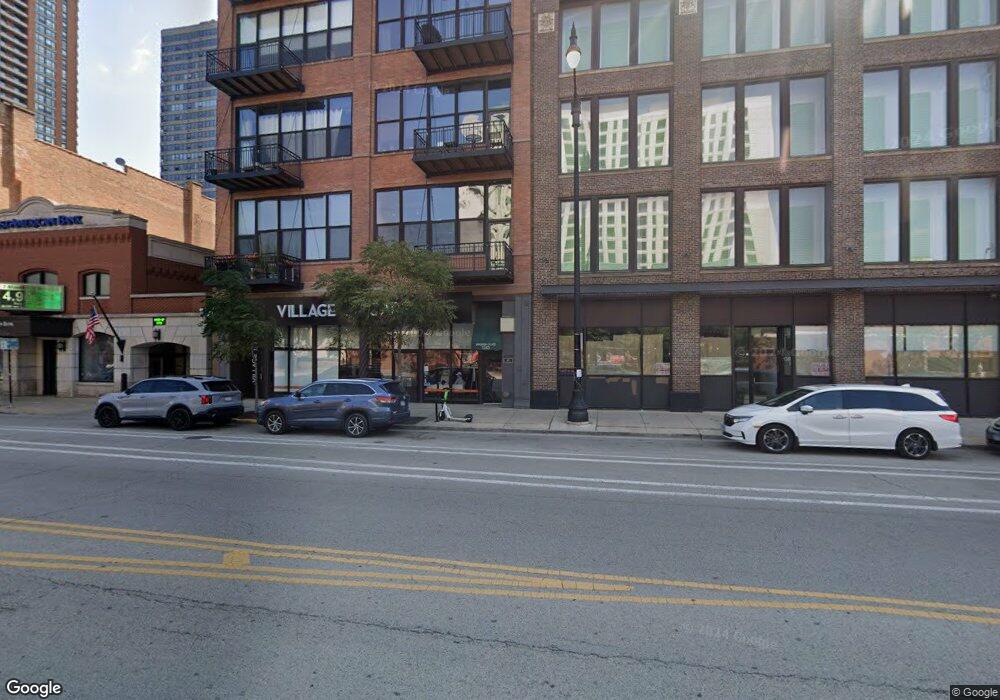
1243 S Wabash Ave Unit PS9 Chicago, IL 60605
South Loop NeighborhoodEstimated Value: $333,000 - $454,000
--
Bed
--
Bath
--
Sq Ft
8,102
Sq Ft Lot
About This Home
This home is located at 1243 S Wabash Ave Unit PS9, Chicago, IL 60605 and is currently estimated at $403,359. 1243 S Wabash Ave Unit PS9 is a home located in Cook County with nearby schools including South Loop Elementary School, Wendell Phillips Academy High School, and Old St. Marys School.
Ownership History
Date
Name
Owned For
Owner Type
Purchase Details
Closed on
Oct 30, 2009
Sold by
Kinzer James
Bought by
Kinzer James and James E Kinzer Revocable Trust
Current Estimated Value
Purchase Details
Closed on
Oct 24, 2003
Sold by
Smith David L
Bought by
Kinzer James
Home Financials for this Owner
Home Financials are based on the most recent Mortgage that was taken out on this home.
Original Mortgage
$272,000
Outstanding Balance
$125,449
Interest Rate
6.04%
Mortgage Type
Unknown
Estimated Equity
$277,910
Purchase Details
Closed on
Aug 28, 2003
Sold by
Brown Michael A and Liu Brown Alice Yu
Bought by
Niemi Kristina A
Home Financials for this Owner
Home Financials are based on the most recent Mortgage that was taken out on this home.
Original Mortgage
$272,000
Outstanding Balance
$125,449
Interest Rate
6.04%
Mortgage Type
Unknown
Estimated Equity
$277,910
Create a Home Valuation Report for This Property
The Home Valuation Report is an in-depth analysis detailing your home's value as well as a comparison with similar homes in the area
Home Values in the Area
Average Home Value in this Area
Purchase History
| Date | Buyer | Sale Price | Title Company |
|---|---|---|---|
| Kinzer James | -- | None Available | |
| Kinzer James | $340,000 | Chicago Title Insurance Comp | |
| Niemi Kristina A | $287,500 | First American Title Ins Co |
Source: Public Records
Mortgage History
| Date | Status | Borrower | Loan Amount |
|---|---|---|---|
| Open | Kinzer James | $272,000 | |
| Previous Owner | Niemi Kristina A | $187,500 | |
| Closed | Kinzer James | $28,000 |
Source: Public Records
Tax History Compared to Growth
Tax History
| Year | Tax Paid | Tax Assessment Tax Assessment Total Assessment is a certain percentage of the fair market value that is determined by local assessors to be the total taxable value of land and additions on the property. | Land | Improvement |
|---|---|---|---|---|
| 2024 | $211 | $1,927 | $270 | $1,657 |
| 2023 | $206 | $1,000 | $221 | $779 |
| 2022 | $206 | $1,000 | $221 | $779 |
| 2021 | $202 | $999 | $220 | $779 |
| 2020 | $381 | $1,712 | $178 | $1,534 |
| 2019 | $374 | $1,864 | $178 | $1,686 |
| 2018 | $368 | $1,864 | $178 | $1,686 |
| 2017 | $346 | $1,606 | $147 | $1,459 |
| 2016 | $322 | $1,606 | $147 | $1,459 |
| 2015 | $294 | $1,606 | $147 | $1,459 |
| 2014 | $244 | $1,316 | $131 | $1,185 |
| 2013 | $239 | $1,316 | $131 | $1,185 |
Source: Public Records
Map
Nearby Homes
- 1250 S Michigan Ave Unit 2704
- 1250 S Michigan Ave Unit 907
- 1250 S Michigan Ave Unit 802
- 1250 S Michigan Ave Unit 2900
- 1250 S Michigan Ave Unit P126
- 1250 S Michigan Ave Unit 1804
- 1250 S Michigan Ave Unit 1400
- 1243 S Wabash Ave Unit 401
- 1305 S Michigan Ave Unit GU223
- 1305 S Michigan Ave Unit 907
- 1305 S Michigan Ave Unit 1706
- 1307 S Wabash Ave Unit 605
- 1307 S Wabash Ave Unit 308
- 1307 S Wabash Ave Unit 312
- 1250 S Indiana Ave Unit 1011
- 1250 S Indiana Ave Unit 802
- 1250 S Indiana Ave Unit 702
- 100 E 14th St Unit 1203
- 100 E 14th St Unit 903
- 100 E 14th St Unit 2409
- 1243 S Wabash Ave Unit PS24
- 1243 S Wabash Ave Unit 602
- 1243 S Wabash Ave Unit PS22
- 1243 S Wabash Ave Unit 403
- 1243 S Wabash Ave Unit 505
- 1243 S Wabash Ave Unit 302
- 1243 S Wabash Ave Unit PS6
- 1243 S Wabash Ave Unit PS13
- 1243 S Wabash Ave Unit PS1
- 1243 S Wabash Ave Unit PS14
- 1243 S Wabash Ave Unit 605
- 1243 S Wabash Ave Unit 502
- 1243 S Wabash Ave Unit PS18
- 1243 S Wabash Ave Unit 604
- 1243 S Wabash Ave Unit 303
- 1243 S Wabash Ave Unit PS25
- 1243 S Wabash Ave Unit PS23
- 1243 S Wabash Ave Unit PS17
- 1243 S Wabash Ave Unit PS15
- 1243 S Wabash Ave Unit PS12