
Seller's Agent in 2019
Jeff Puckett
Compass Slidell (LATT14)
(985) 707-7627
350 in this area
611 Total Sales

Estimated Value: $182,000 - $201,462
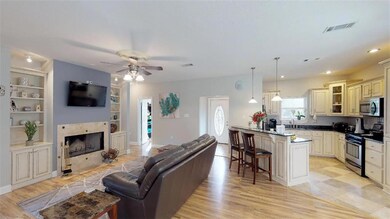
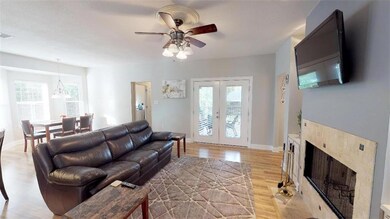
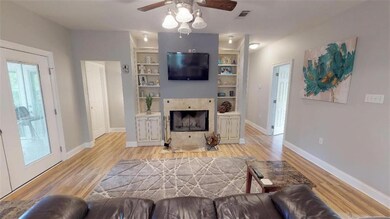
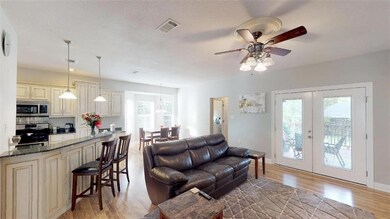
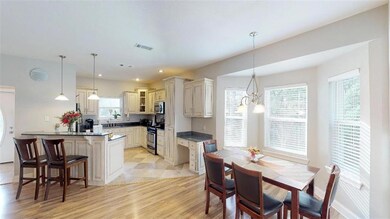
"100% FINANCING AVAILABLE" Precious raised acadian with relaxing front porch perfect for rockers. Great open floor plan offers den with soaring 10' ceiling & cozy fireplace. Kitchen has custom cabinets, granite counters & sunny bay window breakfast area. Spacious master with plenty of natural light & walk-in closet; master bath has garden tub & separate shower. Fabulous back wood eck great for outdoor parties. FREE Home Warranty. See 3D Virtual Tour.
Last Agent to Sell the Property
Compass Slidell (LATT14) License #000015938 Listed on: 11/02/2018
| Date | Buyer | Sale Price | Title Company |
|---|---|---|---|
| Aufrecht Derrick M | $156,000 | None Available |
| Date | Status | Borrower | Loan Amount |
|---|---|---|---|
| Open | Aufrecht Derrick M | $148,200 |
| Date | Event | Price | List to Sale | Price per Sq Ft |
|---|---|---|---|---|
| 01/09/2019 01/09/19 | Sold | -- | -- | -- |
| 12/10/2018 12/10/18 | Pending | -- | -- | -- |
| 11/02/2018 11/02/18 | For Sale | $160,000 | -- | $99 / Sq Ft |
| Year | Tax Paid | Tax Assessment Tax Assessment Total Assessment is a certain percentage of the fair market value that is determined by local assessors to be the total taxable value of land and additions on the property. | Land | Improvement |
|---|---|---|---|---|
| 2024 | $1,771 | $18,412 | $1,000 | $17,412 |
| 2023 | $1,912 | $15,217 | $1,000 | $14,217 |
| 2022 | $151,863 | $15,217 | $1,000 | $14,217 |
| 2021 | $1,518 | $15,217 | $1,000 | $14,217 |
| 2020 | $1,512 | $15,217 | $1,000 | $14,217 |
| 2019 | $2,715 | $15,575 | $1,500 | $14,075 |
| 2018 | $2,721 | $15,575 | $1,500 | $14,075 |
| 2017 | $2,739 | $15,575 | $1,500 | $14,075 |
| 2016 | $2,801 | $15,575 | $1,500 | $14,075 |
| 2015 | $2,790 | $15,575 | $1,500 | $14,075 |
| 2014 | $2,795 | $15,575 | $1,500 | $14,075 |
| 2013 | -- | $15,575 | $1,500 | $14,075 |
Seller's Agent in 2019
Jeff Puckett
Compass Slidell (LATT14)
(985) 707-7627
350 in this area
611 Total Sales
Buyer's Agent in 2019
Brittney Bruskotter
Royal Krewe Realty
(504) 232-1093
3 in this area
110 Total Sales
Source: ROAM MLS
MLS Number: 2179731
APN: 90530