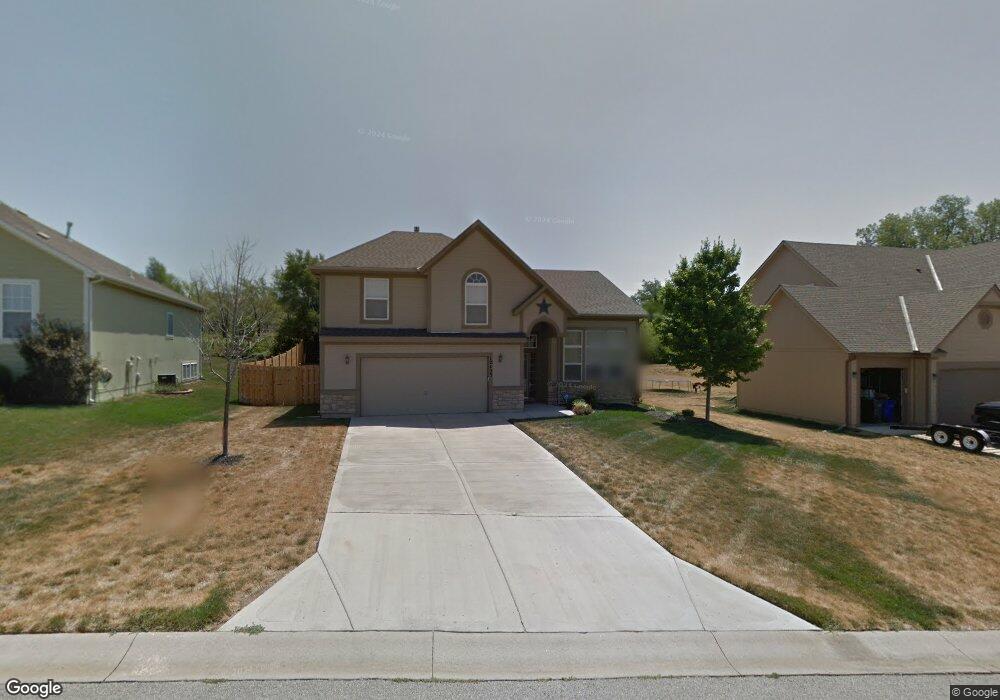
12433 S Sagebrush Dr Olathe, KS 66061
Estimated Value: $391,000 - $432,000
3
Beds
3
Baths
1,701
Sq Ft
$241/Sq Ft
Est. Value
About This Home
This home is located at 12433 S Sagebrush Dr, Olathe, KS 66061 and is currently estimated at $409,267, approximately $240 per square foot. 12433 S Sagebrush Dr is a home located in Johnson County with nearby schools including Millbrooke Elementary, Summit Trail Middle School, and Olathe Northwest High School.
Ownership History
Date
Name
Owned For
Owner Type
Purchase Details
Closed on
Dec 2, 2011
Sold by
Pistole Sean D and Pistole Amber
Bought by
Lucas James
Current Estimated Value
Home Financials for this Owner
Home Financials are based on the most recent Mortgage that was taken out on this home.
Original Mortgage
$151,200
Outstanding Balance
$103,530
Interest Rate
4.03%
Mortgage Type
New Conventional
Estimated Equity
$305,737
Purchase Details
Closed on
May 10, 2007
Sold by
Ldh Construction Inc
Bought by
Pistole Sean D and Pistole Amber
Home Financials for this Owner
Home Financials are based on the most recent Mortgage that was taken out on this home.
Original Mortgage
$161,600
Interest Rate
6.17%
Mortgage Type
New Conventional
Purchase Details
Closed on
Oct 27, 2005
Sold by
Duggan Homes Inc
Bought by
Ldh Constuction Inc
Home Financials for this Owner
Home Financials are based on the most recent Mortgage that was taken out on this home.
Original Mortgage
$160,000
Interest Rate
5.9%
Mortgage Type
Construction
Create a Home Valuation Report for This Property
The Home Valuation Report is an in-depth analysis detailing your home's value as well as a comparison with similar homes in the area
Home Values in the Area
Average Home Value in this Area
Purchase History
| Date | Buyer | Sale Price | Title Company |
|---|---|---|---|
| Lucas James | -- | Chicago Title Company Llc | |
| Pistole Sean D | -- | Chicago Title Ins Co | |
| Ldh Constuction Inc | -- | Chicago Title Ins Co |
Source: Public Records
Mortgage History
| Date | Status | Borrower | Loan Amount |
|---|---|---|---|
| Open | Lucas James | $151,200 | |
| Previous Owner | Pistole Sean D | $161,600 | |
| Previous Owner | Ldh Constuction Inc | $160,000 |
Source: Public Records
Tax History Compared to Growth
Tax History
| Year | Tax Paid | Tax Assessment Tax Assessment Total Assessment is a certain percentage of the fair market value that is determined by local assessors to be the total taxable value of land and additions on the property. | Land | Improvement |
|---|---|---|---|---|
| 2024 | $4,303 | $38,433 | $8,408 | $30,025 |
| 2023 | $4,328 | $37,812 | $7,646 | $30,166 |
| 2022 | $3,870 | $32,925 | $6,369 | $26,556 |
| 2021 | $3,870 | $30,786 | $6,369 | $24,417 |
| 2020 | $3,749 | $30,084 | $6,369 | $23,715 |
| 2019 | $3,759 | $29,958 | $6,369 | $23,589 |
| 2018 | $3,512 | $27,807 | $6,369 | $21,438 |
| 2017 | $3,408 | $26,714 | $5,790 | $20,924 |
| 2016 | $3,104 | $24,967 | $5,211 | $19,756 |
| 2015 | $3,189 | $25,656 | $5,207 | $20,449 |
| 2013 | -- | $22,414 | $4,768 | $17,646 |
Source: Public Records
Map
Nearby Homes
- 21794 W 123rd Terrace
- 1310 N Leeview Cir
- 21320 W 123rd Ct
- 12169 S Valley Rd
- 12421 S Parker Terrace
- The Ranch Villas Plan at Grayson Place
- 21919 W 121st St
- 21510 W 121st St
- 21205 W 125th Terrace
- 21928 W 121st St
- 22049 W 121st St
- 21702 W 119th Terrace Unit 1101
- 12001 S Tallgrass Dr Unit 203
- 11588 S Houston St
- 12386 S Lincoln St
- 11921 S Tallgrass Dr Unit 603
- 11921 S Tallgrass Dr Unit 602
- 11921 S Tallgrass Dr Unit 601
- 12621 S Clinton Ct
- 1002 N Parker Terrace
- 12453 S Sagebrush Dr
- 12413 S Sagebrush Dr
- 12473 S Sagebrush Dr
- 12393 S Sagebrush Dr
- 12414 S Sagebrush Dr
- 12389 S Sagebrush Dr
- 12434 S Sagebrush Dr
- 12392 S Tallgrass Dr
- 12383 S Sagebrush Dr
- 12493 S Sagebrush Dr
- 12394 S Sagebrush Dr
- 12390 S Sagebrush Dr
- 12454 S Sagebrush Dr
- 12373 S Sagebrush Dr
- 12382 S Tallgrass Dr
- 12386 S Sagebrush Dr
- 12382 S Sagebrush Dr
- 12363 S Sagebrush Dr
- 12372 S Tallgrass Dr
- 12362 S Tallgrass Dr