Estimated Value: $725,000 - $813,148
3
Beds
2
Baths
1,820
Sq Ft
$428/Sq Ft
Est. Value
About This Home
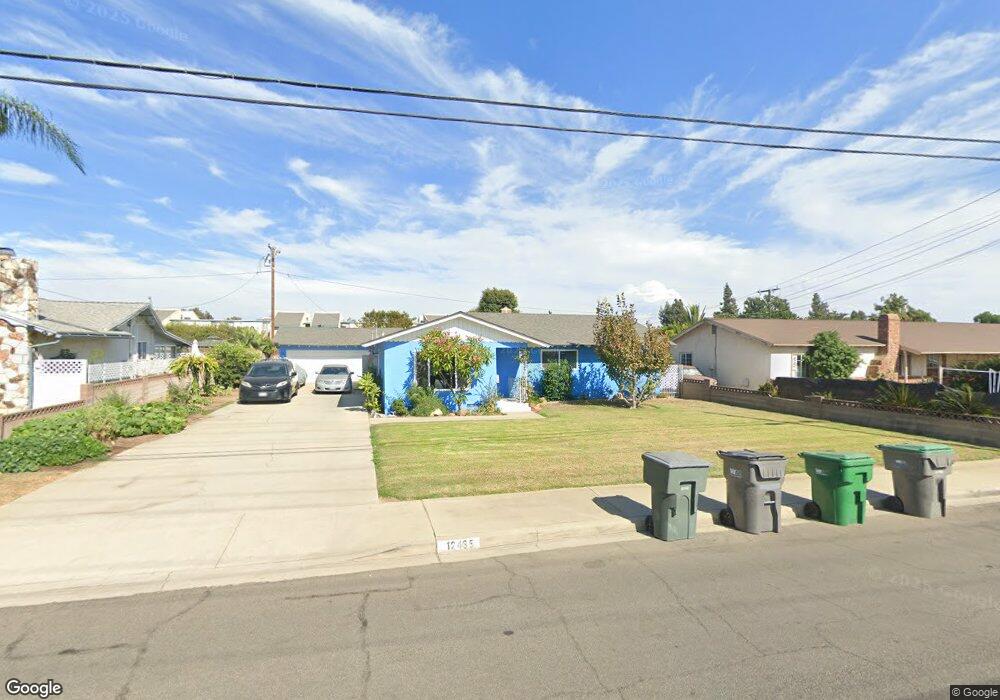
This home is located at 12435 Telephone Ave, Chino, CA 91710 and is currently estimated at $778,537, approximately $427 per square foot. 12435 Telephone Ave is a home located in San Bernardino County with nearby schools including Newman Elementary, Ramona Junior High School, and Don Antonio Lugo High School.
Ownership History
Date
Name
Owned For
Owner Type
Purchase Details
Closed on
Jul 23, 2022
Sold by
Enrique Orozco Luis and Cun Sally
Bought by
2022 Orozco Family Trust
Current Estimated Value
Purchase Details
Closed on
Mar 11, 2005
Sold by
Scheu Jon S
Bought by
Orozco Luis and Orozco Sally
Home Financials for this Owner
Home Financials are based on the most recent Mortgage that was taken out on this home.
Original Mortgage
$350,000
Interest Rate
5.84%
Mortgage Type
Purchase Money Mortgage
Purchase Details
Closed on
Jun 12, 1998
Sold by
Pomona First Fsla
Bought by
Scheu Jon S and Scheu Rosemary A
Home Financials for this Owner
Home Financials are based on the most recent Mortgage that was taken out on this home.
Original Mortgage
$140,287
Interest Rate
7%
Mortgage Type
FHA
Purchase Details
Closed on
Feb 9, 1998
Sold by
Oviedo Miguel A and Oviedo Rosa M
Bought by
Pomona First Fsla and Pff Bank & Trust
Create a Home Valuation Report for This Property
The Home Valuation Report is an in-depth analysis detailing your home's value as well as a comparison with similar homes in the area
Home Values in the Area
Average Home Value in this Area
Purchase History
| Date | Buyer | Sale Price | Title Company |
|---|---|---|---|
| 2022 Orozco Family Trust | -- | None Listed On Document | |
| Orozco Luis | $455,000 | Chicago Title Co | |
| Scheu Jon S | $143,000 | Chicago Title | |
| Pomona First Fsla | $140,000 | Fidelity National Title |
Source: Public Records
Mortgage History
| Date | Status | Borrower | Loan Amount |
|---|---|---|---|
| Previous Owner | Orozco Luis | $350,000 | |
| Previous Owner | Scheu Jon S | $140,287 |
Source: Public Records
Tax History Compared to Growth
Tax History
| Year | Tax Paid | Tax Assessment Tax Assessment Total Assessment is a certain percentage of the fair market value that is determined by local assessors to be the total taxable value of land and additions on the property. | Land | Improvement |
|---|---|---|---|---|
| 2025 | $6,800 | $634,233 | $221,982 | $412,251 |
| 2024 | $6,800 | $621,797 | $217,629 | $404,168 |
| 2023 | $6,610 | $609,605 | $213,362 | $396,243 |
| 2022 | $6,569 | $597,652 | $209,178 | $388,474 |
| 2021 | $5,965 | $543,000 | $190,000 | $353,000 |
| 2020 | $5,742 | $524,300 | $183,100 | $341,200 |
| 2019 | $5,274 | $481,000 | $168,000 | $313,000 |
| 2018 | $5,212 | $476,600 | $167,200 | $309,400 |
| 2017 | $4,853 | $443,300 | $155,500 | $287,800 |
| 2016 | $4,402 | $422,200 | $148,100 | $274,100 |
| 2015 | $4,168 | $402,000 | $141,000 | $261,000 |
| 2014 | $3,873 | $374,000 | $131,000 | $243,000 |
Source: Public Records
Map
Nearby Homes
- 12635 Franklin Ct Unit 8b
- 12686 3rd St
- 4862 Lincoln Ave
- 5382 Park Place
- 4887 Philadelphia St
- 12939 5th St
- 12940 4th St
- 12139 Serra Ave
- 5610 Guardian Way
- 4965 Independence St
- 12836 12th St Unit 27
- 12351 Twin Gables Dr
- 13066 3rd St
- 12540 Ramona Ave
- 5640 Riverside Dr Unit 119
- 13116 3rd St
- 13123 2nd St
- 13115 Monte Vista Ave
- 0 C St
- 12796 17th St
- 12425 Telephone Ave
- 12451 Telephone Ave
- 12440 Telephone Ave
- 12411 Telephone Ave
- 12467 Telephone Ave
- 12450 Telephone Ave
- 12430 Telephone Ave
- 12460 Telephone Ave
- 12420 Telephone Ave
- 12470 Telephone Ave
- 12395 Telephone Ave
- 12410 Telephone Ave
- 12445 Baca Ave
- 12495 Telephone Ave
- 12425 Baca Ave
- 12465 Baca Ave
- 12415 Baca Ave
- 12475 Baca Ave
- 12394 Telephone Ave
- 12490 Telephone Ave