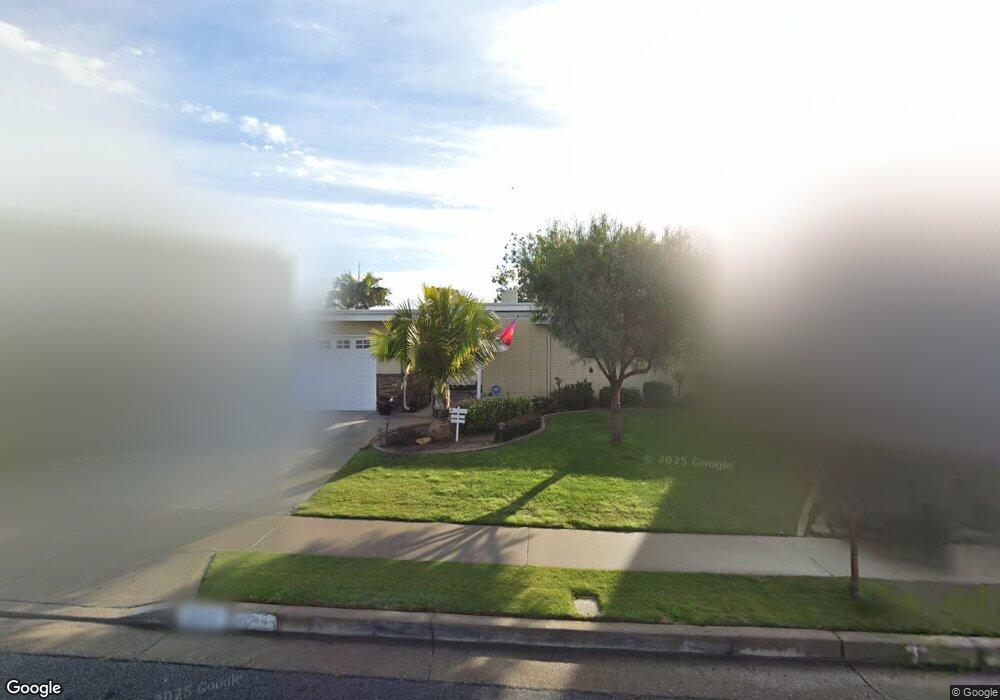
1244 Brian St Placentia, CA 92870
Estimated Value: $1,163,000 - $1,314,000
4
Beds
2
Baths
1,974
Sq Ft
$633/Sq Ft
Est. Value
About This Home
This home is located at 1244 Brian St, Placentia, CA 92870 and is currently estimated at $1,250,283, approximately $633 per square foot. 1244 Brian St is a home located in Orange County with nearby schools including Wagner Elementary School, Col. J. K. Tuffree Middle School, and El Dorado High School.
Ownership History
Date
Name
Owned For
Owner Type
Purchase Details
Closed on
Feb 28, 2022
Sold by
Robinson Shawn P and Robinson Monica
Bought by
Robinson Revocable Living Trust
Current Estimated Value
Purchase Details
Closed on
Aug 19, 2010
Sold by
Velazquez Manuel and Velazquez Ellen
Bought by
Robinson Shawn P and Robinson Monica
Home Financials for this Owner
Home Financials are based on the most recent Mortgage that was taken out on this home.
Original Mortgage
$415,000
Interest Rate
4.26%
Mortgage Type
New Conventional
Purchase Details
Closed on
Apr 14, 1999
Sold by
Beverage Richard E and Beverage Rae W
Bought by
Velazquez Manuel and Velazquez Ellen
Home Financials for this Owner
Home Financials are based on the most recent Mortgage that was taken out on this home.
Original Mortgage
$116,750
Interest Rate
6.96%
Create a Home Valuation Report for This Property
The Home Valuation Report is an in-depth analysis detailing your home's value as well as a comparison with similar homes in the area
Home Values in the Area
Average Home Value in this Area
Purchase History
| Date | Buyer | Sale Price | Title Company |
|---|---|---|---|
| Robinson Revocable Living Trust | -- | None Listed On Document | |
| Robinson Shawn P | $545,000 | Western Resources Title Co | |
| Velazquez Manuel | $267,000 | United Title Company |
Source: Public Records
Mortgage History
| Date | Status | Borrower | Loan Amount |
|---|---|---|---|
| Previous Owner | Robinson Shawn P | $415,000 | |
| Previous Owner | Velazquez Manuel | $116,750 |
Source: Public Records
Tax History
| Year | Tax Paid | Tax Assessment Tax Assessment Total Assessment is a certain percentage of the fair market value that is determined by local assessors to be the total taxable value of land and additions on the property. | Land | Improvement |
|---|---|---|---|---|
| 2025 | $8,132 | $698,236 | $553,544 | $144,692 |
| 2024 | $8,132 | $684,546 | $542,691 | $141,855 |
| 2023 | $7,967 | $671,124 | $532,050 | $139,074 |
| 2022 | $7,860 | $657,965 | $521,617 | $136,348 |
| 2021 | $7,680 | $645,064 | $511,389 | $133,675 |
| 2020 | $7,704 | $638,450 | $506,145 | $132,305 |
| 2019 | $7,401 | $625,932 | $496,221 | $129,711 |
| 2018 | $7,306 | $613,659 | $486,491 | $127,168 |
| 2017 | $7,184 | $601,627 | $476,952 | $124,675 |
| 2016 | $7,040 | $589,831 | $467,600 | $122,231 |
| 2015 | $6,951 | $580,972 | $460,577 | $120,395 |
| 2014 | $6,752 | $569,592 | $451,555 | $118,037 |
Source: Public Records
Map
Nearby Homes
- 1384 Roxborough Dr
- 5142 Hamer Ln
- 718 Kenoak Dr
- 1232 Woodside Dr
- 1000 Henrietta Cir
- 1126 Naples Ave
- 1298 Vina Del Mar Ave
- 1418 Avenida de Vaca
- 1308 Montevideo Ave
- 1280 Dominica Cir
- 1410 Via Cortez
- 1509 Prospect Ave Unit D
- 5472 Westmoreland Dr
- 937 Finnell Way
- 1743 Hamer Dr
- 635 Patten Ave
- 921 Azalea Ave
- 731 Langer Dr
- 324 Rio Grande Ave
- 1202 N Ventana Ln
Your Personal Tour Guide
Ask me questions while you tour the home.