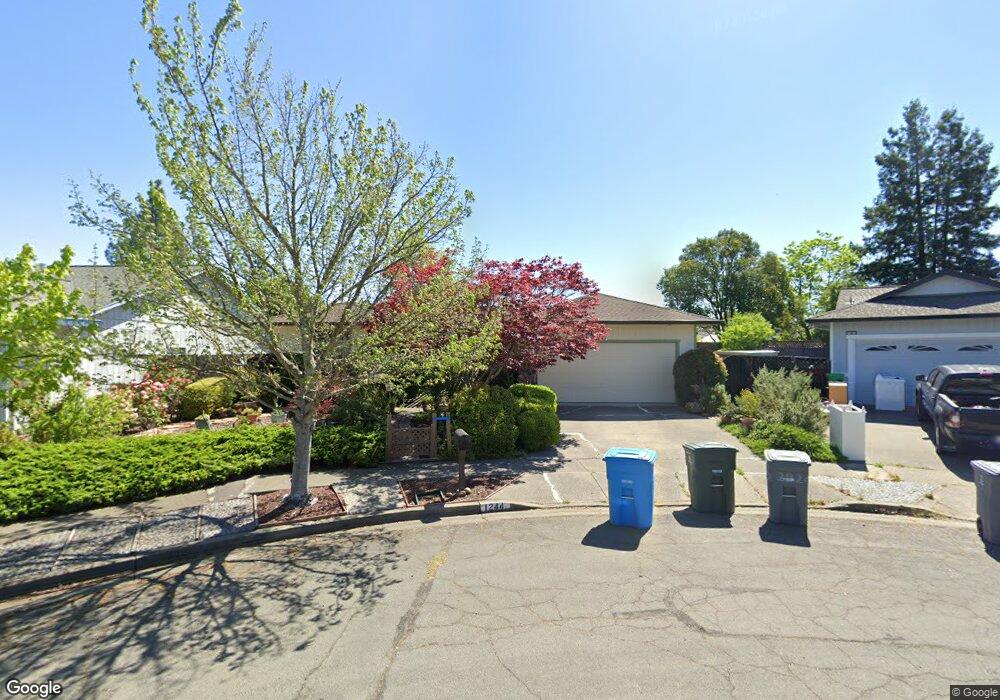
1244 Butte Ct Santa Rosa, CA 95403
Northwest Santa Rosa NeighborhoodEstimated Value: $638,992 - $679,000
3
Beds
2
Baths
1,404
Sq Ft
$464/Sq Ft
Est. Value
About This Home
This home is located at 1244 Butte Ct, Santa Rosa, CA 95403 and is currently estimated at $651,248, approximately $463 per square foot. 1244 Butte Ct is a home located in Sonoma County with nearby schools including Hidden Valley Elementary School, Hilliard Comstock Middle School, and Santa Rosa High School.
Ownership History
Date
Name
Owned For
Owner Type
Purchase Details
Closed on
Aug 18, 2017
Sold by
Dumbrava Lucille C
Bought by
Dumbrava Lucille
Current Estimated Value
Home Financials for this Owner
Home Financials are based on the most recent Mortgage that was taken out on this home.
Original Mortgage
$735,000
Outstanding Balance
$617,553
Interest Rate
4.22%
Mortgage Type
Reverse Mortgage Home Equity Conversion Mortgage
Estimated Equity
$33,695
Purchase Details
Closed on
Sep 30, 2014
Sold by
Phipps Kathleen L and The Ellen E Wilson Revocable T
Bought by
Dumbrava Lucille C
Home Financials for this Owner
Home Financials are based on the most recent Mortgage that was taken out on this home.
Original Mortgage
$175,000
Interest Rate
4.07%
Mortgage Type
New Conventional
Purchase Details
Closed on
May 10, 2008
Sold by
Wilson Ellen E
Bought by
Wilson Ellen E and Ellen E Wilson Revocable Trust
Create a Home Valuation Report for This Property
The Home Valuation Report is an in-depth analysis detailing your home's value as well as a comparison with similar homes in the area
Home Values in the Area
Average Home Value in this Area
Purchase History
| Date | Buyer | Sale Price | Title Company |
|---|---|---|---|
| Dumbrava Lucille | -- | Fidelity Natl Agency Solutio | |
| Dumbrava Lucille C | $359,000 | First American Title Company | |
| Wilson Ellen E | -- | None Available |
Source: Public Records
Mortgage History
| Date | Status | Borrower | Loan Amount |
|---|---|---|---|
| Open | Dumbrava Lucille | $735,000 | |
| Closed | Dumbrava Lucille C | $175,000 |
Source: Public Records
Tax History Compared to Growth
Tax History
| Year | Tax Paid | Tax Assessment Tax Assessment Total Assessment is a certain percentage of the fair market value that is determined by local assessors to be the total taxable value of land and additions on the property. | Land | Improvement |
|---|---|---|---|---|
| 2025 | $4,803 | $431,455 | $172,461 | $258,994 |
| 2024 | $4,803 | $422,996 | $169,080 | $253,916 |
| 2023 | $4,803 | $414,703 | $165,765 | $248,938 |
| 2022 | $4,433 | $406,572 | $162,515 | $244,057 |
| 2021 | $4,378 | $398,601 | $159,329 | $239,272 |
| 2020 | $4,368 | $394,515 | $157,696 | $236,819 |
| 2019 | $4,344 | $386,780 | $154,604 | $232,176 |
| 2018 | $4,318 | $379,197 | $151,573 | $227,624 |
| 2017 | $4,240 | $371,762 | $148,601 | $223,161 |
| 2016 | $4,206 | $364,474 | $145,688 | $218,786 |
| 2015 | $4,078 | $359,000 | $143,500 | $215,500 |
| 2014 | $1,408 | $132,116 | $39,633 | $92,483 |
Source: Public Records
Map
Nearby Homes
- 901 Russell Ave Unit 238
- 90 Estrella Dr
- 3127 Clare Ave
- 4 Estrella Dr
- 817 Mercie St
- 816 Mary St
- 85 Estrella Dr
- 0 Russell Ave
- 2595 Hardies Ln
- 1795 Walnut Creek Dr
- 3593 Banyan St
- 2791 Mcbride Ln Unit 176
- 2829 Apple Valley Ln
- 1945 Piner Rd Unit 16
- 1945 Piner Rd Unit 148
- 1945 Piner Rd Unit 185
- 1945 Piner Rd Unit 47
- 1945 Piner Rd Unit 105
- 1945 Piner Rd Unit 189
- 2147 W Steele Ln