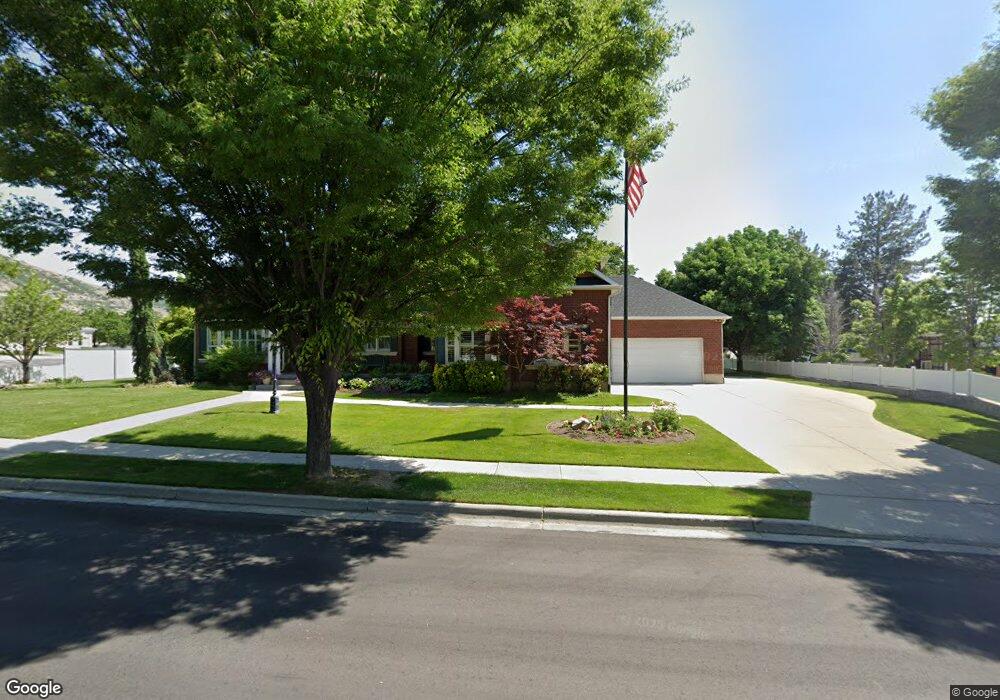
1244 E Walden Ln Draper, UT 84020
Estimated Value: $1,433,000 - $1,898,000
5
Beds
4
Baths
3,550
Sq Ft
$440/Sq Ft
Est. Value
About This Home
This home is located at 1244 E Walden Ln, Draper, UT 84020 and is currently estimated at $1,563,322, approximately $440 per square foot. 1244 E Walden Ln is a home located in Salt Lake County with nearby schools including Draper Elementary School, Draper Park Middle School, and Corner Canyon High School.
Ownership History
Date
Name
Owned For
Owner Type
Purchase Details
Closed on
Sep 22, 1998
Sold by
Nielson Bradley P and Nielson Rosalie S
Bought by
Nielsen Bradley P and Nielsen Rosalie S
Current Estimated Value
Home Financials for this Owner
Home Financials are based on the most recent Mortgage that was taken out on this home.
Original Mortgage
$435,000
Outstanding Balance
$92,761
Interest Rate
6.88%
Estimated Equity
$1,470,561
Purchase Details
Closed on
Sep 12, 1997
Sold by
Christensen Brent D
Bought by
Nielsen Bradley P and Nielsen Rosalie S
Home Financials for this Owner
Home Financials are based on the most recent Mortgage that was taken out on this home.
Original Mortgage
$435,000
Interest Rate
7.34%
Purchase Details
Closed on
Nov 12, 1996
Sold by
Nielsen Bradley P and Nielsen Rosalie S
Bought by
Christensen Brent D
Purchase Details
Closed on
Jan 31, 1996
Sold by
Stringham Mabel E
Bought by
Nielsen Bradley P and Nielsen Rosalie S
Create a Home Valuation Report for This Property
The Home Valuation Report is an in-depth analysis detailing your home's value as well as a comparison with similar homes in the area
Home Values in the Area
Average Home Value in this Area
Purchase History
| Date | Buyer | Sale Price | Title Company |
|---|---|---|---|
| Nielsen Bradley P | -- | Equity Title Agency Inc | |
| Nielsen Bradley P | -- | -- | |
| Christensen Brent D | -- | Backman Stewart Title | |
| Nielsen Bradley P | -- | First American Title |
Source: Public Records
Mortgage History
| Date | Status | Borrower | Loan Amount |
|---|---|---|---|
| Open | Nielsen Bradley P | $435,000 | |
| Previous Owner | Nielsen Bradley P | $435,000 |
Source: Public Records
Tax History
| Year | Tax Paid | Tax Assessment Tax Assessment Total Assessment is a certain percentage of the fair market value that is determined by local assessors to be the total taxable value of land and additions on the property. | Land | Improvement |
|---|---|---|---|---|
| 2025 | $6,360 | $1,300,000 | $624,200 | $675,800 |
| 2024 | $6,360 | $1,215,000 | $600,800 | $614,200 |
| 2023 | $5,901 | $1,119,000 | $577,700 | $541,300 |
| 2022 | $6,249 | $1,144,600 | $566,400 | $578,200 |
| 2021 | $6,184 | $967,500 | $417,200 | $550,300 |
| 2020 | $5,973 | $885,900 | $417,200 | $468,700 |
| 2019 | $5,976 | $866,100 | $417,200 | $448,900 |
| 2016 | $4,527 | $624,200 | $252,600 | $371,600 |
Source: Public Records
Map
Nearby Homes
- 1285 Manfield Way
- 12525 S 1300 E
- 12567 Blacksmith Ln
- 13050 S 1300 E
- 12397 S Relation St Unit 1
- 1518 Stanford Ct
- 1187 E Parkstone Dr
- 12959 S Fort St
- 902 E 12650 S
- 13216 S Telemark Ln
- 847 E Willow Springs Ln
- 12161 S Spring Ridge Cir
- 12882 S Ellerbeck Ln Unit 12882
- 12838 Hickory Ridge Ln
- 1139 Hidden Valley Dr
- 12182 S Pine Valley Way
- 633 E Vandalay Ln
- 834 E 12085 S
- 963 Old English Rd
- 12378 S Course View Ln
- 1244 E Walden Ln
- 1220 Walden Ln
- 1251 E Walden Ln
- 1251 E Walden Ln
- 1225 Walden Ln
- 1206 Walden Ln
- 1206 E Walden Ln
- 1269 E Walden Ln
- 12836 S 1300 E
- 1211 Black Fox Ct
- 12747 Somerdowns Ct
- 12747 S Somerdowns Ct
- 12840 S 1300 E
- 1207 E Black Fox Ct
- 1207 Black Fox Ct
- 1295 Walden Ln
- 12717 Somerdowns Ct
- 1199 Walden Ln
- 12730 S 1300 E
- 12730 S 1300 E Unit U
Your Personal Tour Guide
Ask me questions while you tour the home.