Estimated Value: $204,391 - $247,000
3
Beds
1
Bath
1,733
Sq Ft
$129/Sq Ft
Est. Value
About This Home
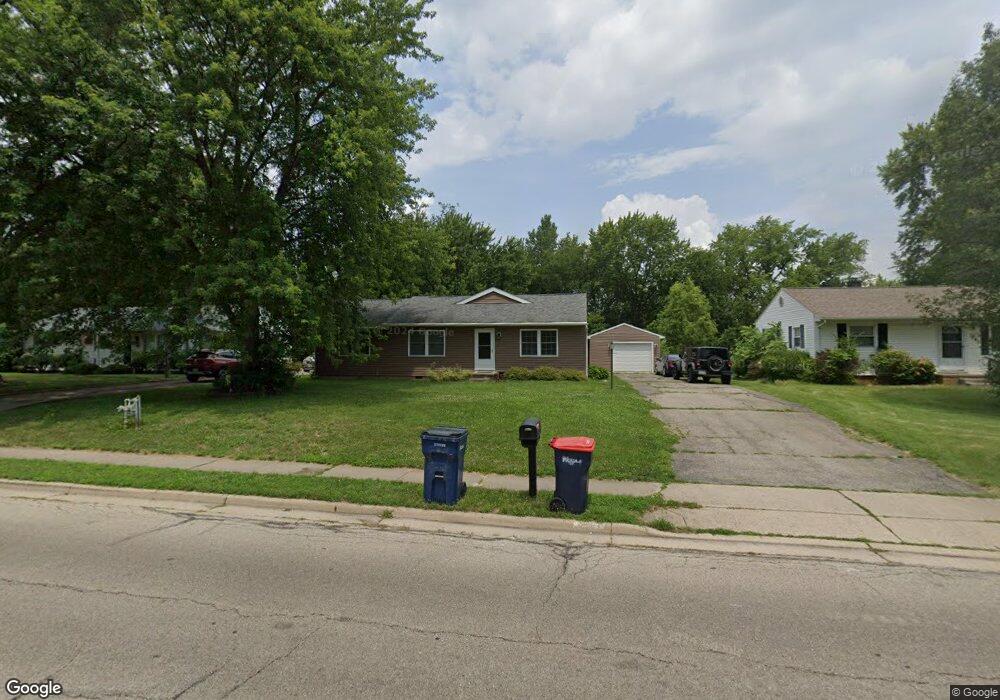
This home is located at 1244 W High St, Piqua, OH 45356 and is currently estimated at $224,348, approximately $129 per square foot. 1244 W High St is a home located in Miami County with nearby schools including Washington Primary School, Piqua Junior High School, and Piqua High School.
Ownership History
Date
Name
Owned For
Owner Type
Purchase Details
Closed on
Oct 30, 2006
Sold by
Forrest Ricky C and Forrest Stephanie M
Bought by
Vance Melissa K and Eleyet Matthew L
Current Estimated Value
Home Financials for this Owner
Home Financials are based on the most recent Mortgage that was taken out on this home.
Original Mortgage
$103,377
Outstanding Balance
$62,140
Interest Rate
6.5%
Mortgage Type
New Conventional
Estimated Equity
$162,208
Purchase Details
Closed on
Jun 19, 2006
Sold by
Forrest Ricky C
Bought by
Forrest Ricky C and Forrest Stephanie M
Purchase Details
Closed on
Jan 23, 2006
Sold by
Forrest Susan Kay
Bought by
Forrest Ricky C
Purchase Details
Closed on
Jan 1, 1990
Bought by
Forrest Ronnie L
Create a Home Valuation Report for This Property
The Home Valuation Report is an in-depth analysis detailing your home's value as well as a comparison with similar homes in the area
Home Values in the Area
Average Home Value in this Area
Purchase History
| Date | Buyer | Sale Price | Title Company |
|---|---|---|---|
| Vance Melissa K | $105,000 | -- | |
| Forrest Ricky C | -- | -- | |
| Forrest Ricky C | -- | -- | |
| Forrest Ronnie L | -- | -- |
Source: Public Records
Mortgage History
| Date | Status | Borrower | Loan Amount |
|---|---|---|---|
| Open | Forrest Ricky C | $103,377 |
Source: Public Records
Tax History Compared to Growth
Tax History
| Year | Tax Paid | Tax Assessment Tax Assessment Total Assessment is a certain percentage of the fair market value that is determined by local assessors to be the total taxable value of land and additions on the property. | Land | Improvement |
|---|---|---|---|---|
| 2024 | $2,031 | $49,420 | $12,390 | $37,030 |
| 2023 | $2,031 | $49,420 | $12,390 | $37,030 |
| 2022 | $2,066 | $49,420 | $12,390 | $37,030 |
| 2021 | $1,674 | $36,610 | $9,170 | $27,440 |
| 2020 | $1,640 | $36,610 | $9,170 | $27,440 |
| 2019 | $1,649 | $36,610 | $9,170 | $27,440 |
| 2018 | $1,369 | $29,020 | $9,170 | $19,850 |
| 2017 | $1,386 | $29,020 | $9,170 | $19,850 |
| 2016 | $1,371 | $29,020 | $9,170 | $19,850 |
| 2015 | $1,402 | $29,020 | $9,170 | $19,850 |
| 2014 | $1,402 | $29,020 | $9,170 | $19,850 |
| 2013 | $1,407 | $29,020 | $9,170 | $19,850 |
Source: Public Records
Map
Nearby Homes
- 1242 W High St
- 1246 W High St
- 1250 W High St
- 1250 W High St
- 1213 Marwood Dr
- 1209 Marwood Dr
- 1217 Marwood Dr
- 1240 W High St
- 1241 W High St
- 1252 W High St
- 1205 Marwood Dr
- 1238 W High St
- 1238 W High St
- 1221 Marwood Dr
- 1239 W High St
- 1254 W High St
- 1201 Marwood Dr
- 1223 Marwood Dr
- 214 Levering Dr
- 1111 Marwood Dr