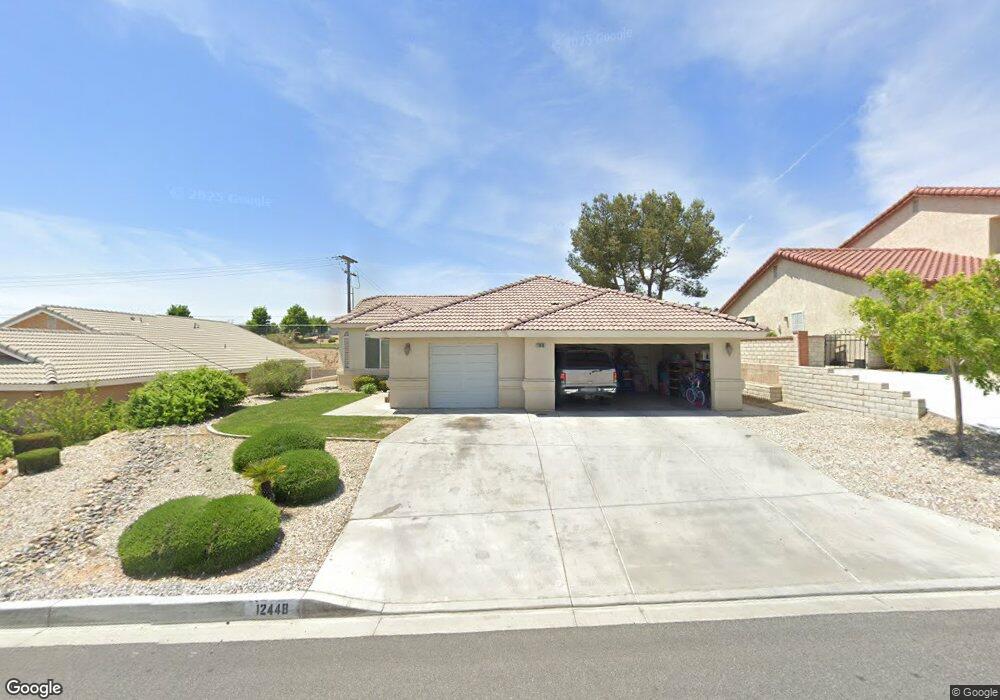
12448 Spring Valley Pkwy Victorville, CA 92395
Estimated Value: $427,000 - $465,000
3
Beds
2
Baths
1,910
Sq Ft
$233/Sq Ft
Est. Value
About This Home
This home is located at 12448 Spring Valley Pkwy, Victorville, CA 92395 and is currently estimated at $444,722, approximately $232 per square foot. 12448 Spring Valley Pkwy is a home with nearby schools including Lomitas Elementary School, Mojave Vista Elementary School, and Lakeview Leadership Academy.
Ownership History
Date
Name
Owned For
Owner Type
Purchase Details
Closed on
Aug 2, 2021
Sold by
Johns Bernadette K
Bought by
Johns Jamesina J
Current Estimated Value
Purchase Details
Closed on
Dec 1, 2009
Sold by
Deutsche Bank National Trust Company
Bought by
Johns Bernadette
Purchase Details
Closed on
May 1, 2009
Sold by
Lambert Jason
Bought by
Indymac Federal Bank Fsb
Purchase Details
Closed on
Feb 23, 2004
Sold by
Hassebrock Elma Myra
Bought by
Lambert Jason
Home Financials for this Owner
Home Financials are based on the most recent Mortgage that was taken out on this home.
Original Mortgage
$226,885
Interest Rate
5.35%
Mortgage Type
Purchase Money Mortgage
Create a Home Valuation Report for This Property
The Home Valuation Report is an in-depth analysis detailing your home's value as well as a comparison with similar homes in the area
Home Values in the Area
Average Home Value in this Area
Purchase History
| Date | Buyer | Sale Price | Title Company |
|---|---|---|---|
| Johns Jamesina J | -- | None Available | |
| Johns Bernadette | $108,000 | Chicago Title Co | |
| Deutsche Bank National Trust Company | -- | Chicago Title Co | |
| Indymac Federal Bank Fsb | $156,942 | None Available | |
| Lambert Jason | $65,000 | First American |
Source: Public Records
Mortgage History
| Date | Status | Borrower | Loan Amount |
|---|---|---|---|
| Previous Owner | Lambert Jason | $226,885 |
Source: Public Records
Tax History Compared to Growth
Tax History
| Year | Tax Paid | Tax Assessment Tax Assessment Total Assessment is a certain percentage of the fair market value that is determined by local assessors to be the total taxable value of land and additions on the property. | Land | Improvement |
|---|---|---|---|---|
| 2025 | $2,546 | $193,623 | $51,634 | $141,989 |
| 2024 | $2,546 | $189,827 | $50,622 | $139,205 |
| 2023 | $4,336 | $336,600 | $81,600 | $255,000 |
| 2022 | $4,266 | $330,000 | $80,000 | $250,000 |
| 2021 | $2,435 | $178,879 | $47,701 | $131,178 |
| 2020 | $2,393 | $177,045 | $47,212 | $129,833 |
| 2019 | $2,357 | $173,573 | $46,286 | $127,287 |
| 2018 | $2,338 | $170,169 | $45,378 | $124,791 |
| 2017 | $2,291 | $166,832 | $44,488 | $122,344 |
| 2016 | $2,247 | $163,561 | $43,616 | $119,945 |
| 2015 | $2,169 | $161,104 | $42,961 | $118,143 |
| 2014 | $2,131 | $157,948 | $42,119 | $115,829 |
Source: Public Records
Map
Nearby Homes
- 18151 Deer Park Ln
- 12411 Spring Valley Pkwy
- 0 Pahute Ave
- 12575 Coronado Ln
- 12566 Fairway Rd
- 18189 Kalin Ranch Dr
- 18199 Kalin Ranch Dr
- 12707 Fairway Rd
- 0 Francesca Rd
- 18257 Deauville Dr
- 12840 Santa Anita Trail
- 12780 Golf Course Dr
- 0 I Ave Unit HD25248296
- 0 I Ave
- 0 I Ave Unit HD25259590
- 0 I Ave Unit TR25022240
- 12690 Augusta Way
- 12865 Amberwood Ln
- 12855 Fairway Rd
- 18065 Pebble Beach Dr
- 12458 Spring Valley Pkwy
- 12438 Spring Valley Pkwy
- 12468 Spring Valley Pkwy
- 12428 Spring Valley Pkwy
- 12478 Spring Valley Pkwy
- 18155 Deer Park Ln
- 12421 Spring Valley Pkwy
- 12418 Spring Valley Pkwy
- 12465 Spring Valley Pkwy
- 18157 Deer Park Ln
- 12488 Spring Valley Pkwy
- 12408 Spring Valley Pkwy
- 18146 Deer Park Ln
- 12483 Spring Valley Pkwy
- 18145 Pahute Ave
- 0 Spring Valley Lake Pkwy Unit 522066
- 18154 Deer Park Ln
- 18145 Pahute Dr
- 18167 Deer Park Ln
- 12401 Spring Valley Pkwy